Are Financial Market Returns Randomly Distributed?
James Picerno | Apr 29, 2022 07:40AM ET
The art and science of modelling returns of financial assets is forever unsatisfying because no one model fully captures the true behavior of asset performances. As a result, there comes a point when researchers are forced to pick a poison that appears less wrong than the alternatives.
Subjectivity on this front is unavoidable for any number of tasks in portfolio management and design. From simulating to forecasting and beyond, every modelling exercise in finance tends to come down to using a set of approximations that don’t offend our expectations too harshly.
As a simple example, consider the distribution of US equity market returns. Are they normally distributed? The answer depends on the time window. In turn, the implications cast a long shadow on what you can, and can’t, reasonably achieve with modelling.
Consider how one-day returns are distributed via SPDR S&P 500 (NYSE:SPY), an ETF proxy for the US stock market (based on data for 1993-2022). In the chart below, it’s clear that returns are basically symmetric around 0. SPY’s one-day performances don’t exactly match a theoretically pure random distribution (red line), but they’re close enough so that most of the time, and for most modelling applications, you can assume normality prevails.
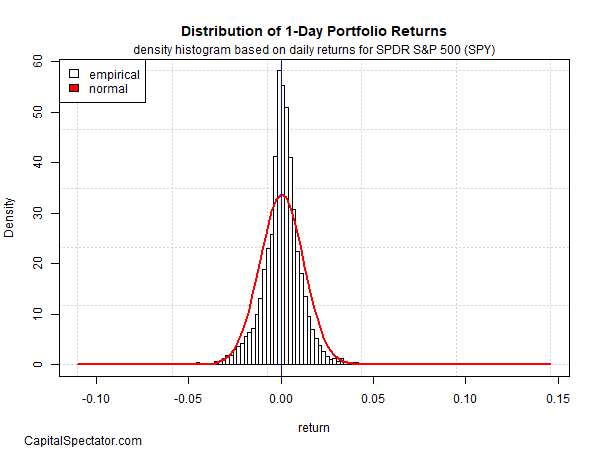
This assumption has a wide range of implications. For example, if one-day returns closely follow a normal distribution, forecasting one-day returns is futile, at least most of the time.
But there’s nothing normal about the one-year return distribution for SPY, as the second chart reminds. The results are positively skewed and there’s a clear incidence of fat tails. The one-year distribution, in short, tells a very different story from one-day returns and so the opportunities for this time window are quite different vs. one-day results.
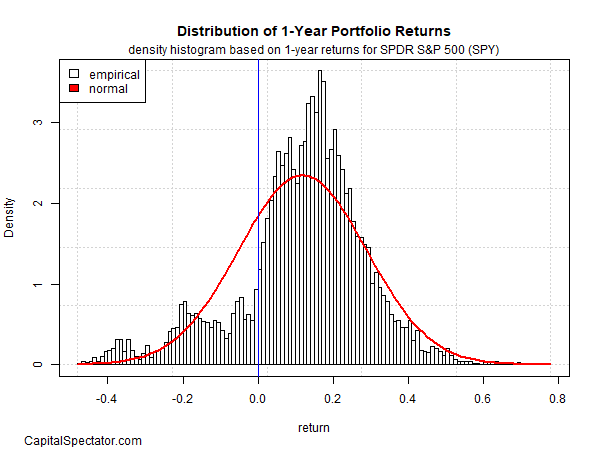
As one example, the difference implies that one-year returns provide the basis for relatively reliable forecasts. You don’t need a Ph.D. in finance to see that your odds are forecasting success are considerably higher with a one-year time horizon vs. one day. Or perhaps it’s more accurate to say that you’re likely to be less wrong with one-year forecasts vs. one-day estimates.
But while one-day returns are approximately random, they’re not perfectly random. Although it’s hard to see in the distribution chart above, one-day changes have fat tails – relatively extreme results that run afoul of a normal distribution. For a clearer view on this front, we can run a Q-Q plot, or quantile-quantile plot, which compares the empirical data (black circles) with a theoretical distribution – in this case a normal distribution (red line).
If SPY’s one-day returns were perfectly normal, they’d match the red line. That’s true for a substantial portion of the data set, but at the extremes there are clear divergences. On the left side, daily losses are much steeper than expected in a normal distribution. The opposite is true for relatively large gains.
A similar profile applies to the one-year results. The main takeaway: departures from the normal distribution suggest that forecasting, simulating and other modelling tasks can be improved by factoring in fat tails and other features applicable to non-normal distributions.
But opportunity is a two-sided coin. If you’re not going to use a normal distribution to model the data, which distribution is appropriate? There are several possibilities, and each comes with its own set of pros and cons. The challenge is that no matter which distribution model you select, it will be wrong in some degree. Despite decades of research, no one has yet identified or developed a distribution that perfect matches how equity returns vary in the real world.
That inspires some researchers to stick with the historical record, which relieves us of the need to select a specific model. But that leads to its own set of issues. Simulating returns based on the historical record is easy and arguably accurate, but there are challenges with deciding how to maintain the serial correlation of financial time series, for example.
Every time you solve one challenge in modelling market returns, risk and other facets of financial assets, you create another challenge. No surprise, then, that moving closer to a perfect model, while forever elusive, often requires modelling from multiple perspectives and perhaps using average results as a benchmark.
“All models are wrong, but some are useful,” the statistician George Box famously quipped. Deciding which ones are useful, or not, still involves a hefty dose of intuition and subjectivity. No matter how long you torture the data, it never tells you all the secrets you’re desperate to hear.
Trading in financial instruments and/or cryptocurrencies involves high risks including the risk of losing some, or all, of your investment amount, and may not be suitable for all investors. Prices of cryptocurrencies are extremely volatile and may be affected by external factors such as financial, regulatory or political events. Trading on margin increases the financial risks.
Before deciding to trade in financial instrument or cryptocurrencies you should be fully informed of the risks and costs associated with trading the financial markets, carefully consider your investment objectives, level of experience, and risk appetite, and seek professional advice where needed.
Fusion Media would like to remind you that the data contained in this website is not necessarily real-time nor accurate. The data and prices on the website are not necessarily provided by any market or exchange, but may be provided by market makers, and so prices may not be accurate and may differ from the actual price at any given market, meaning prices are indicative and not appropriate for trading purposes. Fusion Media and any provider of the data contained in this website will not accept liability for any loss or damage as a result of your trading, or your reliance on the information contained within this website.
It is prohibited to use, store, reproduce, display, modify, transmit or distribute the data contained in this website without the explicit prior written permission of Fusion Media and/or the data provider. All intellectual property rights are reserved by the providers and/or the exchange providing the data contained in this website.
Fusion Media may be compensated by the advertisers that appear on the website, based on your interaction with the advertisements or advertisers.