Apple: Between A Bottom And A Hard $500
Dr. Duru | Jun 05, 2013 04:11AM ET
About six weeks have passed since Apple (AAPL) printed an apparent bottom in the wake of the tumultuous trading surrounding its April earnings report. With the benefit of hindsight, I think it is worthwhile to look back at some important highlights to consider whether this bottom is a sustainable one and what the prospects might be for further upside in the near-term.
One of the most intriguing patterns that emerged in Apple’s trading was the tight correlation between the put/call open interest ratio and AAPL’s stock price. Apple’s post-earnings recovery peaked as soon as that put/call ratio peaked. (Apple reported earnings on April 23rd. I discussed the pre-earnings trade the $17B in Apple corporate bonds that were bought at the end of April. If so, then shares short should not decrease much further from current levels.
So far, so good. It seems AAPL can sustain a bottom. However, it seems for most of the summer, AAPL is also highly unlikely to surpass the $500 mark.
Such an achievement would finally fill most of the large January post-earnings gap down. Apple’s option open interest includes what is essentially a brick wall of calls at the $500 strike. In June, July, and August, the open interest on calls at the $500 strike far surpasses almost all other open interest, calls and puts. In July, an even larger swell exists at the $600 strike; these options are essentially now worthless (and expire BEFORE July earnings on the 23rd).
A large swell of open interest is important because of the amount of money at stake. For example, market makers have a substantial interest in seeing Apple remain below $500 to maximize profits. I also suspect that some Apple holders have sold covered calls at $500 (particularly for July expiration) with the assumption that the stock would not overcome that level anytime soon.
I post below the open interest configurations for June, July, and August from Schaeffer’s. Each chart is followed by the timeline of open interest using data from Etrade.com. (I have positioned the cursor in each timeline where the largest jump in open interest seems to happen).
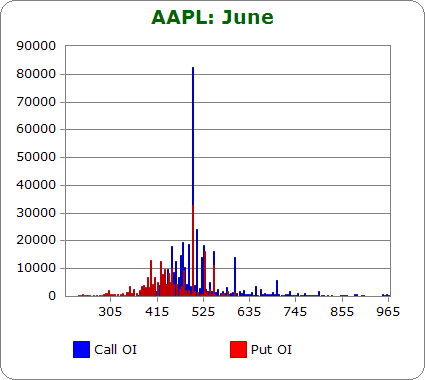
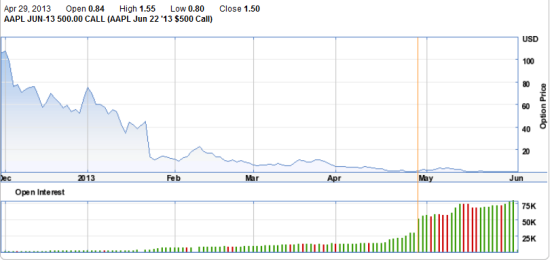
Note that in each configuration, the dominance of the $500 calls sticks out like it beckons for attention. Time is running out for the June and July $500 holders as prices have eroded significantly from much higher levels months ago. The August holders are likely helped by higher implied volatility from July earnings. As those earnings approach, $500 should become a major focal point of resistance for Apple’s stock, like a hard stop. On a valuation basis, AAPL would still only hold a 12 trailing and forward P/E at $500, so it is reasonable to expect that speculators could continue to pile into the $500 call strikes, adding to the likely resistance at that level.
AAPL gained 10% in 10 calendar days after April earnings and almost another 10% in another 9 days to the most recent peak, so it is certainly possible that AAPL can gain a lot of ground in a hurry. However, I would be highly surprised to see AAPL closing in on $500 by June expiration. A run to $500 for July expiration is much more intriguing given the proximity to earnings and the possibility of a round trip from January earnings.
Traders insisting on playing such a run may be better served by a call spread like 490/500 ($490 long, $500 short). Assuming Apple will hit a brick wall near or at $500, the call spread cuts the cost of the trade roughly in half while giving up almost none of the potential upside around the time of expiration.
This analysis benefited from hindsight and took a snapshot of the current trading behavior. In the coming weeks, it will be important to watch how these scenarios change and to adjust if necessary. Apple’s bias finally seems bullish now with major selling and sentiment overhang removed and major buyers firmly in place.
If the bullish momentum increases, it will next become important to watch for excesses that could slow the stock down again; for example, a surge in open interest at lower strikes and/or a put/call ratio drops much lower than current levels around the 25 percentile ranked over the last one to two years. The stock gets the “benefit of the doubt” on dips unless it breaks that major mid-May turning point.
Disclosure: Long AAPL shares and calls
Trading in financial instruments and/or cryptocurrencies involves high risks including the risk of losing some, or all, of your investment amount, and may not be suitable for all investors. Prices of cryptocurrencies are extremely volatile and may be affected by external factors such as financial, regulatory or political events. Trading on margin increases the financial risks.
Before deciding to trade in financial instrument or cryptocurrencies you should be fully informed of the risks and costs associated with trading the financial markets, carefully consider your investment objectives, level of experience, and risk appetite, and seek professional advice where needed.
Fusion Media would like to remind you that the data contained in this website is not necessarily real-time nor accurate. The data and prices on the website are not necessarily provided by any market or exchange, but may be provided by market makers, and so prices may not be accurate and may differ from the actual price at any given market, meaning prices are indicative and not appropriate for trading purposes. Fusion Media and any provider of the data contained in this website will not accept liability for any loss or damage as a result of your trading, or your reliance on the information contained within this website.
It is prohibited to use, store, reproduce, display, modify, transmit or distribute the data contained in this website without the explicit prior written permission of Fusion Media and/or the data provider. All intellectual property rights are reserved by the providers and/or the exchange providing the data contained in this website.
Fusion Media may be compensated by the advertisers that appear on the website, based on your interaction with the advertisements or advertisers.