Apple: Loss Of 200-Day Simple Moving Average Targets $105-110
Dr. Arnout ter Schure | Jun 11, 2021 02:38PM ET
It has been a month since I last provided an update on Apple shares (NASDAQ:AAPL). Back then, it was trading at around $122-123. Now, it’s trading at $127, a 4% gain in a month. That is not much to write home about, nor much that helps me constructively assess the next most likely move. Besides, while the NASDAQ Composite and the Nasdaq 100 are close to their all-time highs, albeit having been range-bound since February this year, Apple is still down 11.8% from its January all-time high. It is underperforming these two major indexes. Not to mention in comparison to the S&P 500 and Dow Jones Industrial Average, which have set fresh all-time highs almost daily. Thus, all Apple has done so far is hold its 200-day Simple Moving Average (SMA) on three occasions. See Figure 1 below.
As long as it can do that, the bulls have a shot at keeping prices elevated.
Figure 1. AAPL Daily candlestick chart with technical indicators and preferred Elliott Wave count
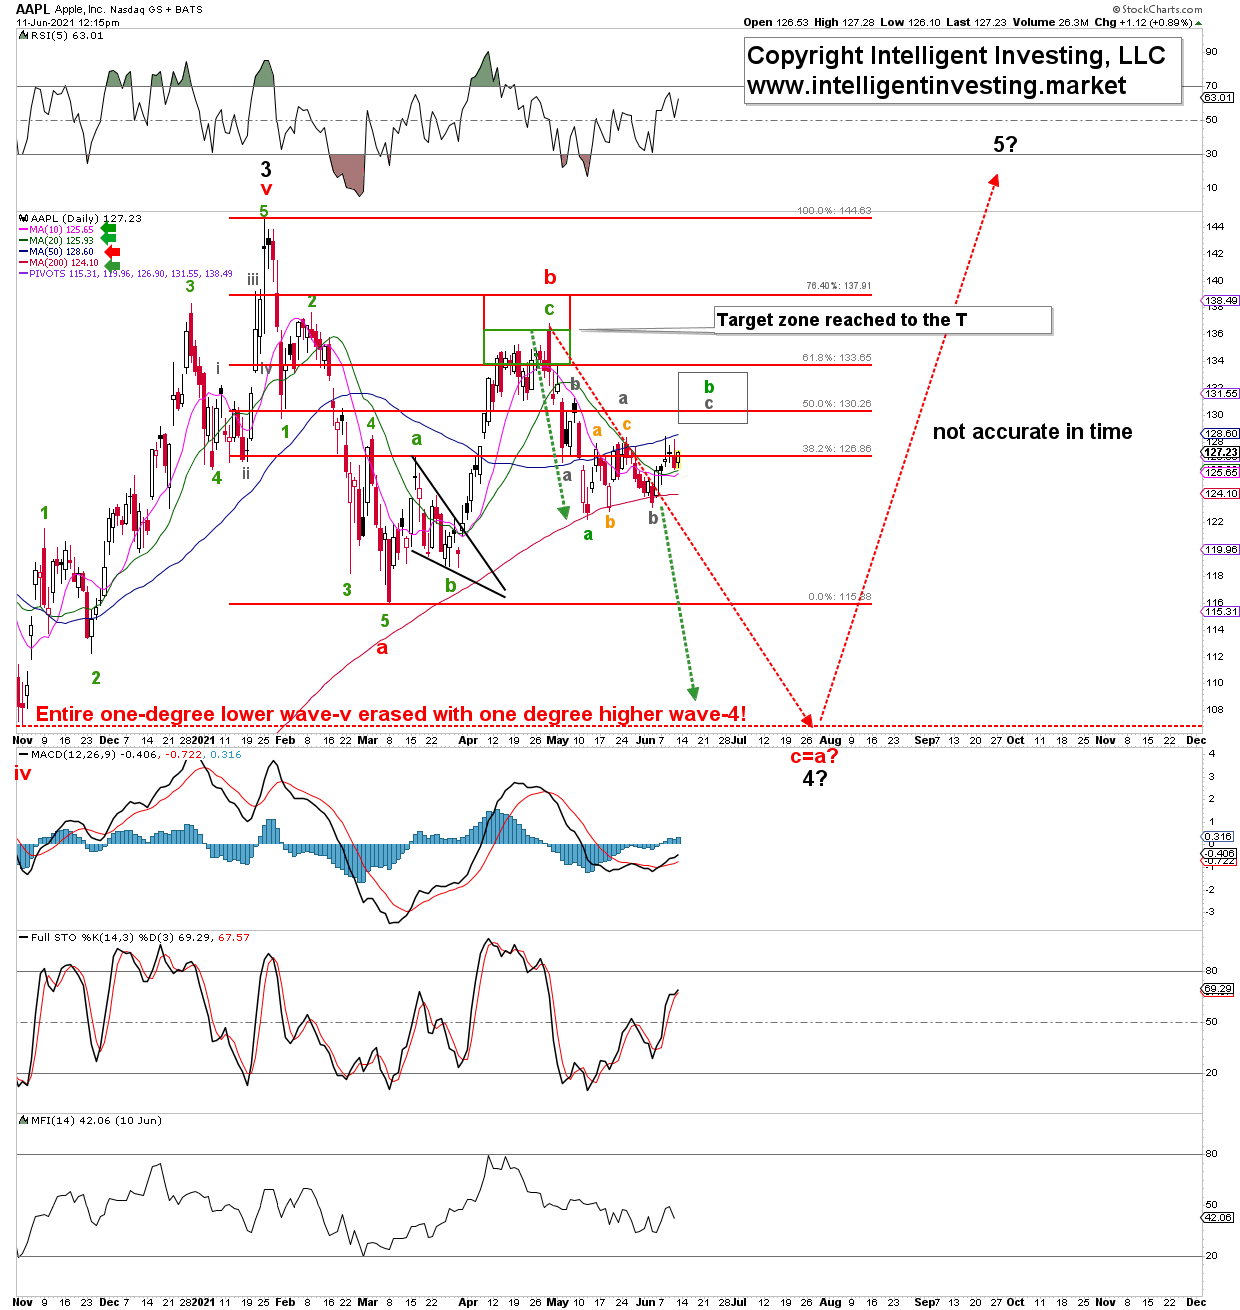
However, Apple is still below its 50-day SMA. As long as it is, the pressure remains down over the intermediate term. The price action since my last update has been somewhat overlapping and, thus, according to the Elliott Wave Principle (EWP) , it is most likely corrective. I expect it – at best – to top out in the grey target zone of $132+/-2 before heading lower to the $105-110 area to complete wave-c of c of 4.
Buyers have stepped in three times at the 200-day SMA, and it is logical to assume that a fourth time there will not be any charm, and sellers will likely take over. The green dotted arrows show symmetry breakdown targets in the ideal (black) major wave-4 target zone.
Bottom line: Apple is underperforming the essential major U.S. indexes. That by itself is a sign of weakness. It has only gained 4% over a month, is barely holding on to its 200-day SMA, while having lost its 50-day SMA as support. The price action during the past month has been erratic and, per the EWP, it is, therefore, most likely corrective – i.e., when complete, expect Apple’s share price to move down again. Whereas a rally to around $132+/-2 first cannot be excluded, a loss of the 200-day SMA will then swiftly target the ideal $105-110 target zone, from where I still expect the next multi-month rally to start.
Trading in financial instruments and/or cryptocurrencies involves high risks including the risk of losing some, or all, of your investment amount, and may not be suitable for all investors. Prices of cryptocurrencies are extremely volatile and may be affected by external factors such as financial, regulatory or political events. Trading on margin increases the financial risks.
Before deciding to trade in financial instrument or cryptocurrencies you should be fully informed of the risks and costs associated with trading the financial markets, carefully consider your investment objectives, level of experience, and risk appetite, and seek professional advice where needed.
Fusion Media would like to remind you that the data contained in this website is not necessarily real-time nor accurate. The data and prices on the website are not necessarily provided by any market or exchange, but may be provided by market makers, and so prices may not be accurate and may differ from the actual price at any given market, meaning prices are indicative and not appropriate for trading purposes. Fusion Media and any provider of the data contained in this website will not accept liability for any loss or damage as a result of your trading, or your reliance on the information contained within this website.
It is prohibited to use, store, reproduce, display, modify, transmit or distribute the data contained in this website without the explicit prior written permission of Fusion Media and/or the data provider. All intellectual property rights are reserved by the providers and/or the exchange providing the data contained in this website.
Fusion Media may be compensated by the advertisers that appear on the website, based on your interaction with the advertisements or advertisers.