Another Advance On Indices' Negative Breadth
Guy S. Ortmann, CMT | Oct 07, 2021 08:44AM ET
Data Remains Mostly Neutral
The major equity indexes closed mixed yesterday with the large-cap indexes posting gains as the rest declined. Once again, the advances occurred on negative breadth suggesting the validity of the gains is somewhat suspect. As all will know, the negative cumulative breadth in the markets has been a concern for us. It remains so.
One index managed to close above its 50 DMA, but the current mix of neutral and negative chart trends was unaffected at the close of trade. There was very little movement on the data dashboard that continues to send a generally neutral message. So, despite the futures implying a strong open this morning, the overall landscape of the charts and data suggest it is too early to alter our current “neutral/negative” near-term macro-outlook for equities.
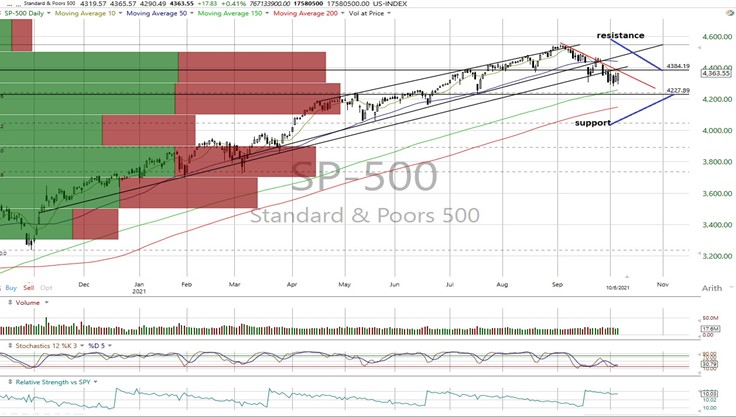
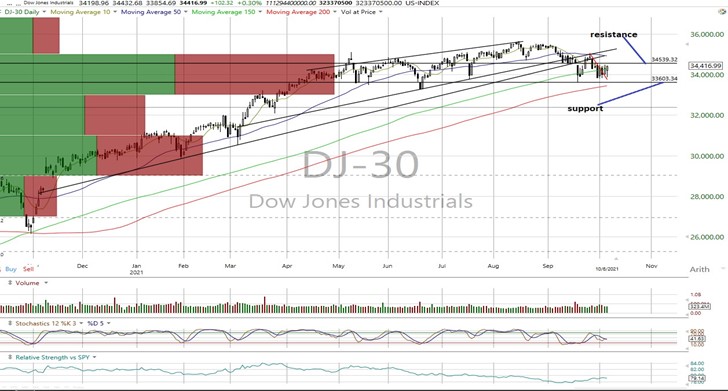
On the charts, the major equity indexes closed mixed yesterday with the SPX, DJI, COMPQX, NDX, and DJT posting gains as the MID, RTY, and VALUA posted losses.
- As noted above, the gains on the large-cap indexes occurred with negative breadth on both the NYSE (1502/1759) and NASDAQ (1732/2722) on higher trading volumes versus the prior session. We have stated frequently that our discipline suggests bullish moves on negative breadth should be held suspect as it implies a weakening structure.
- The net result of the action saw the DJT close back above its 50 DMA but none of the short-term trends were altered as the SPX, COMPQX, NDX and RTY are negative with the rest neutral.
- As would be expected, cumulative market breadth remains negative on the All Exchange, NYSE and NASDAQ with all below their 50 DMAs.
- No stochastic signals were generated.
The data finds the McClellan 1-Day OB/OS Oscillators remaining neutral (All Exchange: -15.96 NYSE: -6.52 NASDAQ: -22.5).
- The detrended Rydex Ratio (contrarian indicator) measuring the action of the leveraged ETF traders at 0.73 was unchanged and remains neutral versus its bearish implications prior to the recent correction.
- The Open Insider Buy/Sell Ratio is still neutral at 35.7 as of its last reading.
- This week’s contrarian AAII Bear/Bull Ratio (39.73/26.8) turned mildly bullish as bearish sentiment increased while the bulls waned. That “crowd” is now nervous. The Investors Intelligence Bear/Bull Ratio (22.1/46.5) (contrary indicator) was little changed and remains neutral.
- Valuation finds the forward 12-month consensus earnings estimate from Bloomberg lifting to $213.13 for the SPX. As such, the SPX forward multiple is 20.5 with the “rule of 20” finding fair value at approximately 18.5.
- The SPX forward earnings yield is 4.88%.
- The 10-year Treasury yield dipped to 1.52%. We see resistance and support remaining at 1.55% and 1.38% respectfully.
In conclusion, yesterday’s deceptively positive action had no effect on the chart trends while market breadth continues to suggest a weak foundation continues to exist. So, even though the futures suggest a strong open, the current state of the charts and data suggest it is appropriate to keep our near-term macro-outlook for equities at “neutral/negative.”
SPX: 4,228/4,384 DJI: 33,600/34,539 COMPQX: 14,030/14,670 NDX: 14,054/14,920
DJT: 13,976/14,560 MID: 2,617/2,680 RTY: 2,200/2,280 VALUA: 9,361/9,590
All charts courtesy of Worden
S&P 500
Dow Jones Industrials
NASDAQ Composite
NASDAQ 100
Dow Jones Transports
S&P Midcap 400
Russell 2000 Futures
Trading in financial instruments and/or cryptocurrencies involves high risks including the risk of losing some, or all, of your investment amount, and may not be suitable for all investors. Prices of cryptocurrencies are extremely volatile and may be affected by external factors such as financial, regulatory or political events. Trading on margin increases the financial risks.
Before deciding to trade in financial instrument or cryptocurrencies you should be fully informed of the risks and costs associated with trading the financial markets, carefully consider your investment objectives, level of experience, and risk appetite, and seek professional advice where needed.
Fusion Media would like to remind you that the data contained in this website is not necessarily real-time nor accurate. The data and prices on the website are not necessarily provided by any market or exchange, but may be provided by market makers, and so prices may not be accurate and may differ from the actual price at any given market, meaning prices are indicative and not appropriate for trading purposes. Fusion Media and any provider of the data contained in this website will not accept liability for any loss or damage as a result of your trading, or your reliance on the information contained within this website.
It is prohibited to use, store, reproduce, display, modify, transmit or distribute the data contained in this website without the explicit prior written permission of Fusion Media and/or the data provider. All intellectual property rights are reserved by the providers and/or the exchange providing the data contained in this website.
Fusion Media may be compensated by the advertisers that appear on the website, based on your interaction with the advertisements or advertisers.