An Early Fall And Alphabet Soup For The Semiconductor Index
Dragonfly Capital | Aug 09, 2012 08:24AM ET
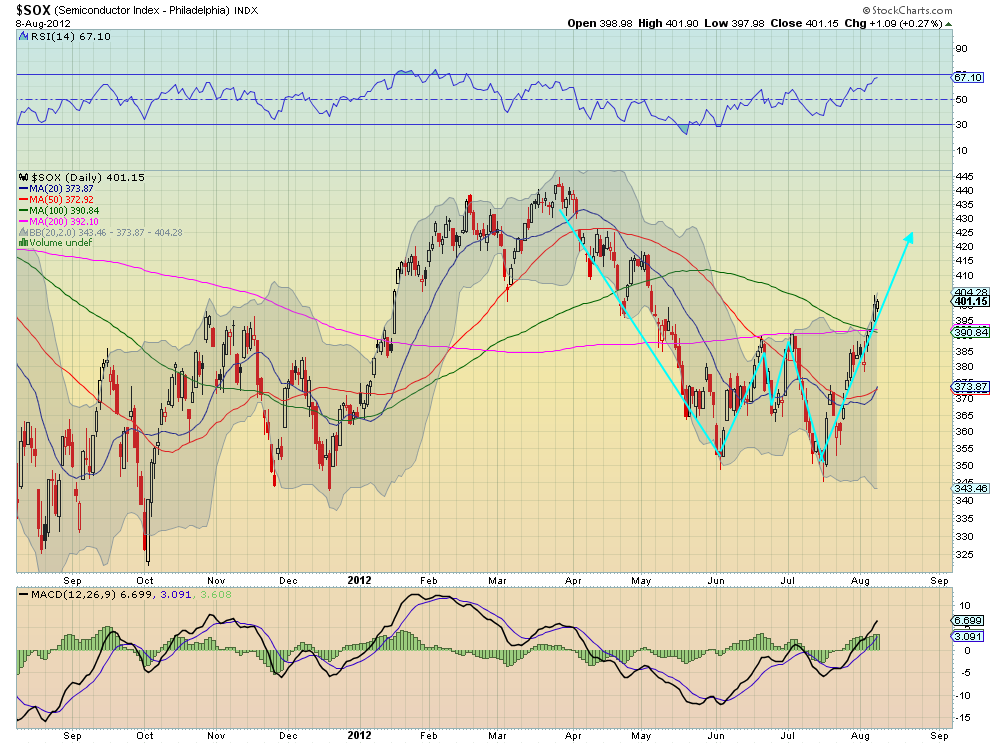
The Semiconductor Index, SOX, is rising up as the markets head towards the end of summer. The chart below shows the long move lower from mid March through to June, followed by a ‘M’ pattern that failed at a double bottom at 350 in mid July. Since then a rise higher and over all of the Simple Moving Averages (SMA) is looking to complete a ‘W’ pattern with a target of 445. The two and a half month move lower in the initial leg suggests that the symmetrical move higher will end at the beginning of October. The Relative Strength Index (RSI) and Moving Average Convergence Divergence indicator (MACD) both support this rise. Everyone is on board. From a seasonal perspective it may be putting your socks on a bit early, but they will be pulled up just in time for the fall weather.
The information in this blog post represents my own opinions and does not contain a recommendation for any particular security or investment. I or my affiliates may hold positions or other interests in securities mentioned in the Blog, please see my
![]()
Trading in financial instruments and/or cryptocurrencies involves high risks including the risk of losing some, or all, of your investment amount, and may not be suitable for all investors. Prices of cryptocurrencies are extremely volatile and may be affected by external factors such as financial, regulatory or political events. Trading on margin increases the financial risks.
Before deciding to trade in financial instrument or cryptocurrencies you should be fully informed of the risks and costs associated with trading the financial markets, carefully consider your investment objectives, level of experience, and risk appetite, and seek professional advice where needed.
Fusion Media would like to remind you that the data contained in this website is not necessarily real-time nor accurate. The data and prices on the website are not necessarily provided by any market or exchange, but may be provided by market makers, and so prices may not be accurate and may differ from the actual price at any given market, meaning prices are indicative and not appropriate for trading purposes. Fusion Media and any provider of the data contained in this website will not accept liability for any loss or damage as a result of your trading, or your reliance on the information contained within this website.
It is prohibited to use, store, reproduce, display, modify, transmit or distribute the data contained in this website without the explicit prior written permission of Fusion Media and/or the data provider. All intellectual property rights are reserved by the providers and/or the exchange providing the data contained in this website.
Fusion Media may be compensated by the advertisers that appear on the website, based on your interaction with the advertisements or advertisers.