All That Glitters When The World Jitters Is Probably Gold
Chris Vermeulen | Jun 21, 2020 04:05AM ET
The economic pressures and concerns within the global markets have not abated just because the US Fed has ramped up the printing presses. Inversely, the stock market price levels may be elevated based on a false expectation of a quick recovery and of future expectations that may be very unrealistic.
In terms of technical analysis, Gold has set up a very interesting sideways basing pattern after recently breaking above a major resistance channel near $1720. Our research team believes the recent base in Gold, near $1720 to $1740 is setting up just like the 2005 to 2007 peak in the US stock markets – just before the Credit Crisis hit in 2008. We believe the similarities of the current and past events, in price and in technical/fundamental data, are strangely similar.
An underlying asset/economic class had recently experienced a stupendous bullish rally. This euphoric rally phase was brought on because the US Fed and global markets were running high on cash and credit – heck, everyone was. The “no fear” mentality was running wild, and so was the market. Suddenly, it appeared that the credit markets were seizing up and that interest rates had nearly doubled or tripled overnight as banks and lending institutions reacted to the US Fed raising rates. At that point, the catalyst for the Credit Crisis had already been set up – much like what is happening today.
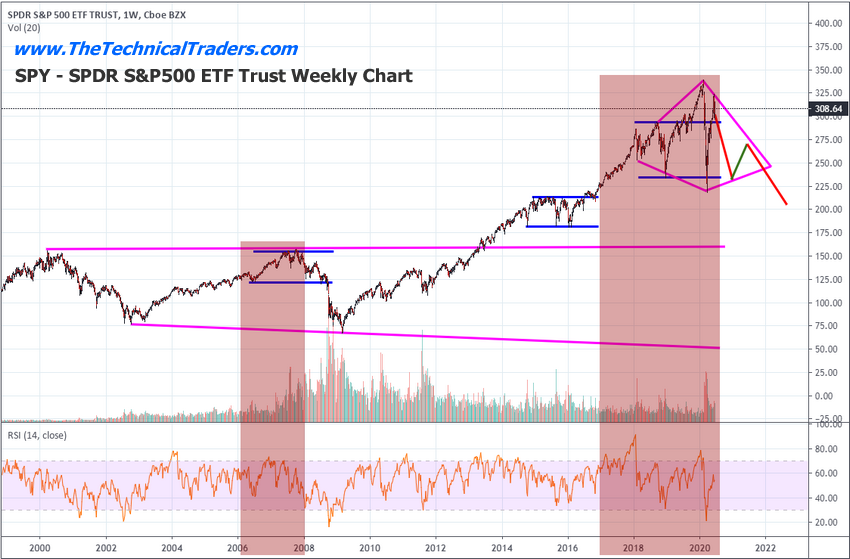
SPY – SPDR S&P500 ETF Trust Weekly Chart
This SPDR S&P 500 (NYSE:SPY) chart highlights the similarities between 2006-08 and now. It may be difficult for you to see on this compressed chart, but the price pattern we’ve experienced over the past 2+ years is very similar to the price pattern that set up the peak in the markets near October 2007. This time, volatility appears to be 3x or 4x the levels from 2006/07 – yikes.
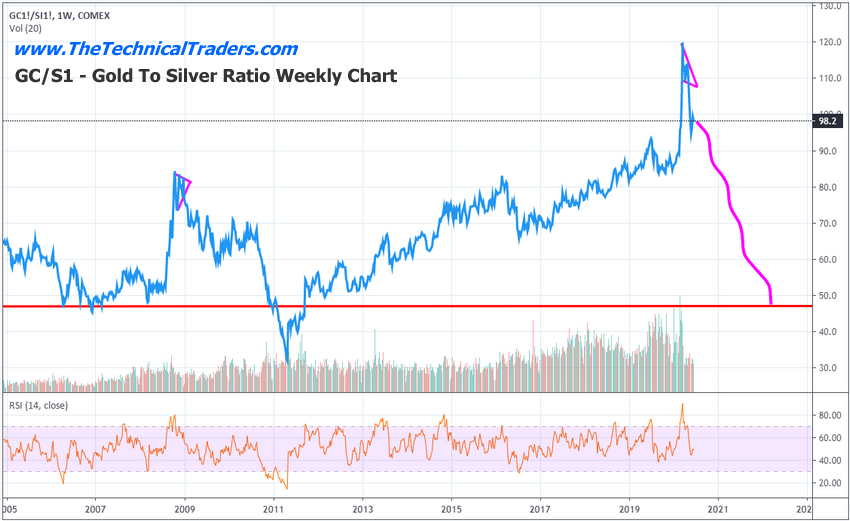
Gold to Silver Price Ratio Weekly Chart
The current level relating the price of Gold to the price of Silver is around 99 – an extremely high historical level. There has never been a time like this in history where Gold has achieved this high of a price ratio compared to Silver. It is very likely that Gold has rallied to these current levels as a “global hedge against risk” and that Silver has simply been overlooked as a secondary asset. Even though supply for Gold and Silver has been decreased over the past 6+ months because of demand and the COVID-19 virus, we believe the current pricing relationships present a very clear opportunity for skilled technical traders.
Traditionally, the Gold to Silver ratio will likely fall to levels below 65 to normalize the price disparity. This suggests that Silver may see a 2x or 3x rally over the next 12+ months and Gold would likely see a 60% to 150% rally from current levels.
Gold Futures Weekly Chart
This Gold Futures Weekly Chart highlights Fibonacci Expansion ratios from similar pre-expansion price ranges. The first measures the advance of Gold from 2001 to 2008 – the peak of the 2008 markets. The second measures the advance of Gold from 2015 to the recent peak (2020) – the presumed peak in the US stock markets
The overlapping Fibonacci expansion levels on this chart paints a very clear picture that Gold may attempt to target certain levels should it begin a much broader upside price move…
_ $1950 – Key initial target level and could become minor resistance.
_ $2250 – The next major target level representing a 2x expansion from the initial 2008 price rally.
_ $2731 – This key level is like to become the bigger target for 2020. Our research team believes the alignment of this level with the current price expansion in Gold sits perfectly as the next upside price target.
_ $3200 – This upper price target shows some importance – yet it is still quite far away from current price levels. Still, it is a valid upside price target.
GLTR Precious Metals ETF Daily Chart
This Daily GLTR chart highlights the current FLAG formation that has setup in price and is about to breakout/breakdown. Our researchers believe the obvious breakout move to the upside is going to happen given the current global economic environment and the fact that we are looking at Q2 data within 10+ days that will likely shock many investors. Notice that our Fibonacci price modeling system has drawn UPPER GREEN and LOWER RED triggers levels well above and below the current FLAG APEX level. This adaptive p[rice modeling system attempts to track price rotation and ranges while adapting internal factoring levels to identify proper Trigger and Target levels. At this point, GLTR must move above $85 to trigger a new BULLISH TREND or below $77.50 to trigger a new BEARISH TREND.
GLTR Precious Metals ETF Weekly Chart
This Weekly GLTR chart highlights a 100% Fibonacci expansion range from the previous upside price rally levels. Should GLTR breakout to the upside and complete a 100% measured upside price move, the next target level for GLTR would be $94.70 – nearly 15.5% higher.
This is an incredible opportunity for skilled technical traders if they understand how the precious metals and miners sectors are aligning for a bigger move higher. There has rarely been a time in history where Gold and Silver have been this depressed in terms of pricing when the global economy and stock markets have been this inflated/elevated. It really may be the “opportunity of a lifetime”.
We believe the next 15 to 30+ days will prompt a “melt-up” in Gold to levels near $2000 to $2100. Silver will likely rally to levels above $25 to $26 over that same span of time. Once the bigger price breakout begins in Silver, attempting to normalize to the advanced price levels in Gold, Silver will begin to rally much quicker than Gold prices. We believe that will happen as Gold nears and breaches the $2000 price level.
For skilled technical traders, this extended price move in Precious Metals, Miners, and a host of other sectors presents a very clear opportunity to time and execute some very exciting trades. We had been warning our friends and followers for over 18+ months now that the end of 2019 and all of 2020 was going to be incredible years for skilled traders. Don’t miss the bigger moves – they are about to unfold over the next 30 to 60+ days and continue well into 2022.
Trading in financial instruments and/or cryptocurrencies involves high risks including the risk of losing some, or all, of your investment amount, and may not be suitable for all investors. Prices of cryptocurrencies are extremely volatile and may be affected by external factors such as financial, regulatory or political events. Trading on margin increases the financial risks.
Before deciding to trade in financial instrument or cryptocurrencies you should be fully informed of the risks and costs associated with trading the financial markets, carefully consider your investment objectives, level of experience, and risk appetite, and seek professional advice where needed.
Fusion Media would like to remind you that the data contained in this website is not necessarily real-time nor accurate. The data and prices on the website are not necessarily provided by any market or exchange, but may be provided by market makers, and so prices may not be accurate and may differ from the actual price at any given market, meaning prices are indicative and not appropriate for trading purposes. Fusion Media and any provider of the data contained in this website will not accept liability for any loss or damage as a result of your trading, or your reliance on the information contained within this website.
It is prohibited to use, store, reproduce, display, modify, transmit or distribute the data contained in this website without the explicit prior written permission of Fusion Media and/or the data provider. All intellectual property rights are reserved by the providers and/or the exchange providing the data contained in this website.
Fusion Media may be compensated by the advertisers that appear on the website, based on your interaction with the advertisements or advertisers.