A Typical Day For Gold As Rally Is Reversed On 30 Minute Chart
Anna Coulling | Aug 13, 2018 06:22AM ET
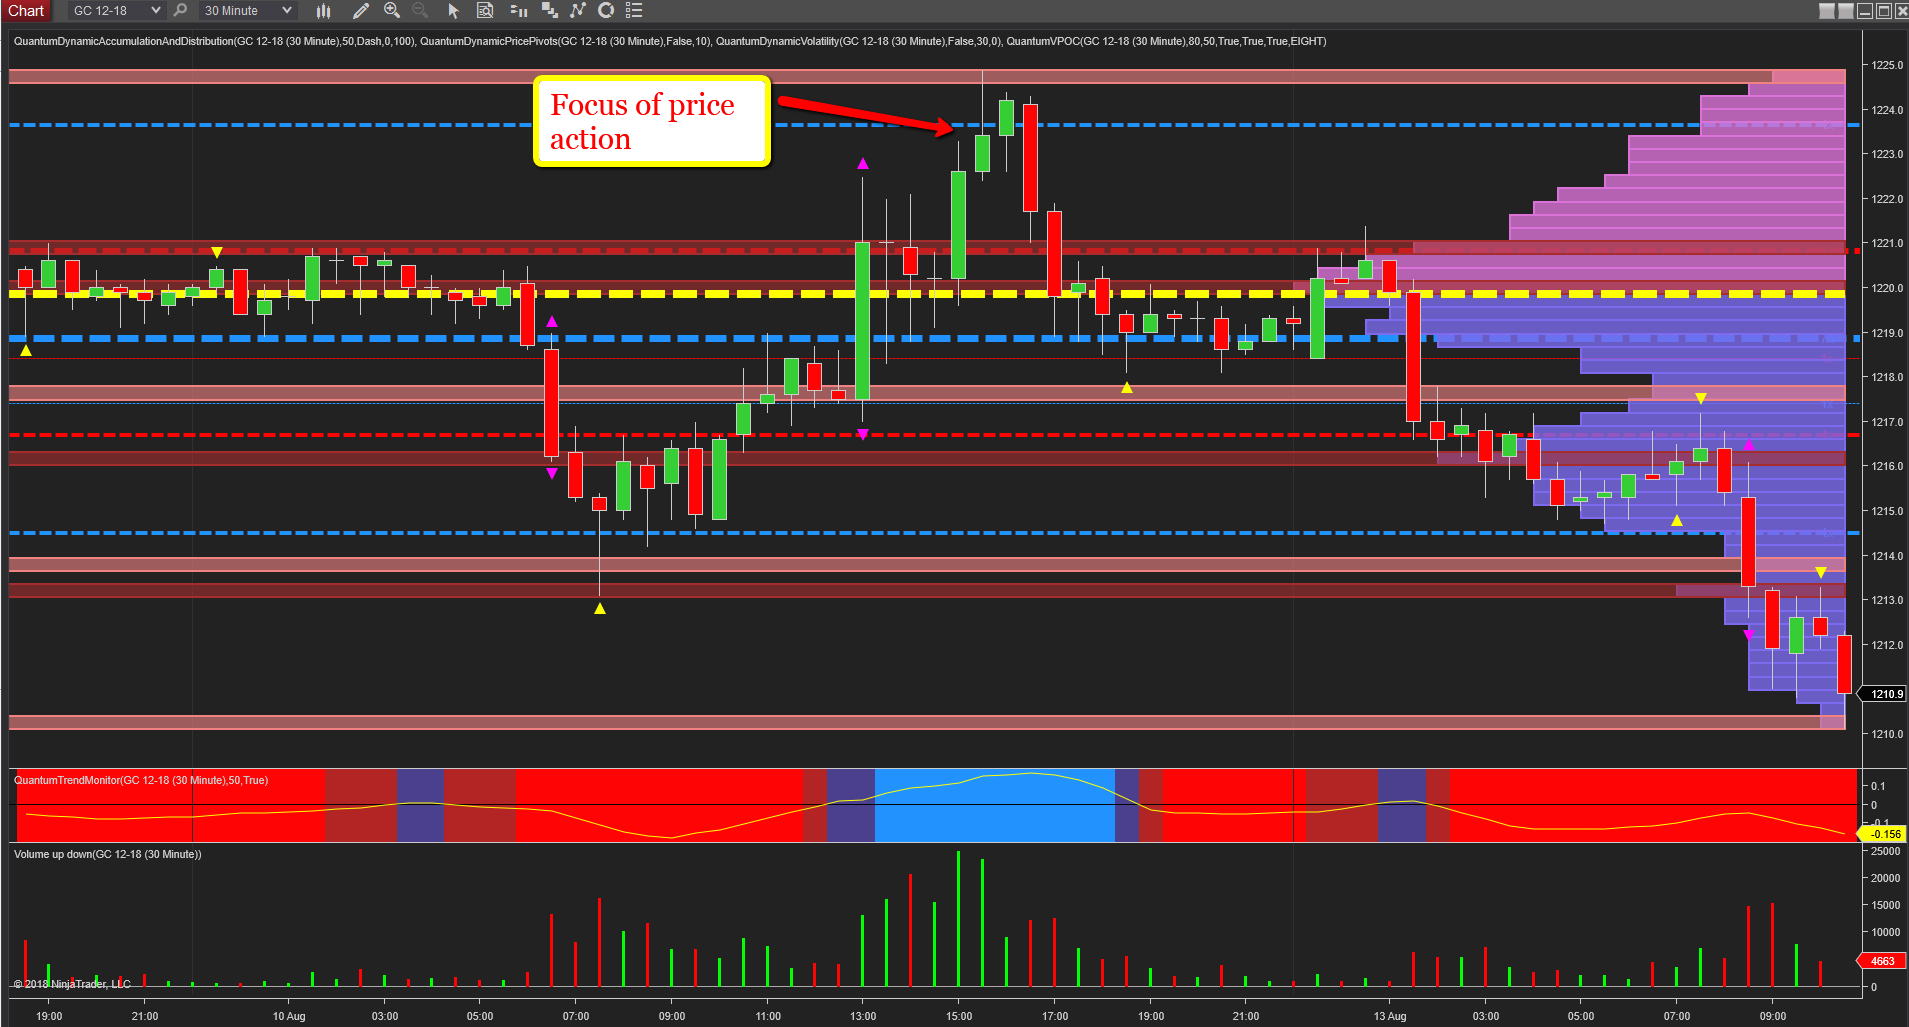
The 30 minute chart for gold makes for interesting reading and reflects the bearish sentiment for gold which remains firmly in place on the slower timeframes of the daily and the weekly charts. Here the price action spans a two day period covering last Friday’s price action and at the start of a new trading week with the Far East and Asia then moving into the European and London session. And once again, a rally higher is snuffed out by the sellers.
If we start with last Friday, the key price action occurred as the US markets opened to the centre of the chart, but note the candle and volume of the 15.00 candle. The preceding candle looks fine with volume and price in agreement. In other words a wide spread up candle associated with high volume. Then follows the candle with a deep wick to the upper body and high volume once again. Clearly an anomaly and one which signals heavy selling which is confirmed with the following candle, a weak effort to rally higher on average volume. This candle is then engulfed with a wide spread down candle and triggering a collapse once more. The key support region at $1219 per ounce was duly breached overnight in Asia and as we move deeper into the London session heavy selling continues with the trend monitor indicator remaining red and only moving into a transitional phase in Asia. The volume point of control is adding further downwards pressure from the $1220 per ounce area, and with low volume nodes now immediately ahead, the short term outlook remains very bearish as does the longer term.
![]()
Trading in financial instruments and/or cryptocurrencies involves high risks including the risk of losing some, or all, of your investment amount, and may not be suitable for all investors. Prices of cryptocurrencies are extremely volatile and may be affected by external factors such as financial, regulatory or political events. Trading on margin increases the financial risks.
Before deciding to trade in financial instrument or cryptocurrencies you should be fully informed of the risks and costs associated with trading the financial markets, carefully consider your investment objectives, level of experience, and risk appetite, and seek professional advice where needed.
Fusion Media would like to remind you that the data contained in this website is not necessarily real-time nor accurate. The data and prices on the website are not necessarily provided by any market or exchange, but may be provided by market makers, and so prices may not be accurate and may differ from the actual price at any given market, meaning prices are indicative and not appropriate for trading purposes. Fusion Media and any provider of the data contained in this website will not accept liability for any loss or damage as a result of your trading, or your reliance on the information contained within this website.
It is prohibited to use, store, reproduce, display, modify, transmit or distribute the data contained in this website without the explicit prior written permission of Fusion Media and/or the data provider. All intellectual property rights are reserved by the providers and/or the exchange providing the data contained in this website.
Fusion Media may be compensated by the advertisers that appear on the website, based on your interaction with the advertisements or advertisers.