A Tradable Bottom In U.S. Equities?
Cam Hui | Aug 10, 2014 11:23PM ET
Weekly Trend Model signal
Trend Model signal: Risk-off (downgrade)
Direction of last change: Positive (unconfirmed upgrade)
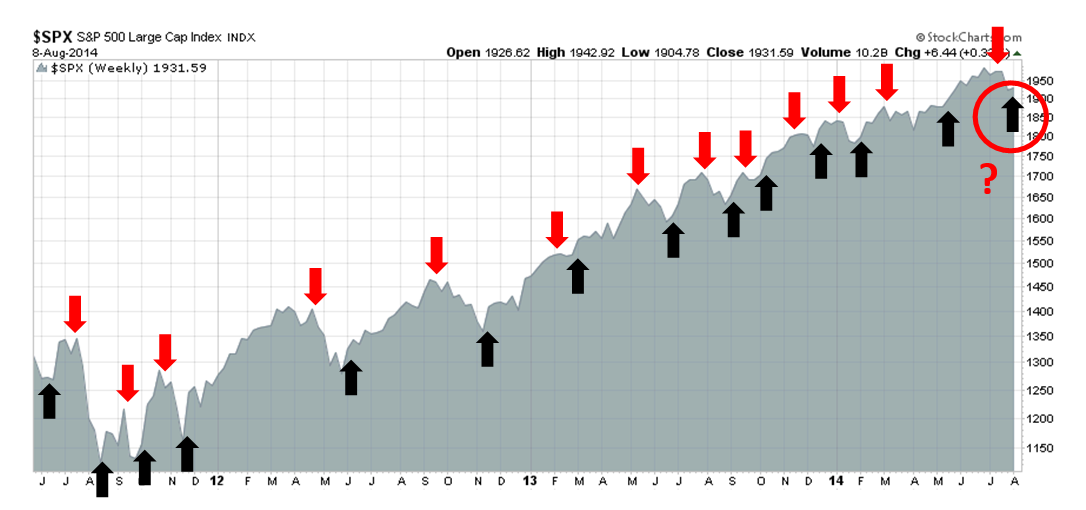
The real-time (not back-tested) signals of the Trend Model is shown in the chart below:
Volatility is coming: A high risk of whipsaw
To address some of these weaknesses, I have relied on a series of sentiment based indicators to better time entry and exit points. These sentiment models primarily focus on measures of sentiment from option data, largely because the option market is reflective of what people are doing with their money rather than sentiment surveys where people express opinions which may or may not be acted upon. I also cross-check the conclusions from the option data models with overbought-oversold indicators. These short-term sentiment based indicators tend to used more for risk control purposes.
Here is an example of how the two components interact with each other. If the trend-following model is flashing a buy signal and the markets are in an uptrend, but the sentiment models are showing a crowded long and an extremely overbought condition, I would be inclined to either lower my long position, move to cash, or perhaps take a very small short position in anticipation of a pullback.
So in answer to the question of how systematic or discretionary are the trading decisions, the signals of both of trend-following components and the short-term sentiment indicators are systematic, but their interpretation is somewhat discretionary.
Trend following models: Risk-off
Let's consider what each of the components are saying now. From an intermediate term perspective, the trend following components of the models are screaming "risk-off".
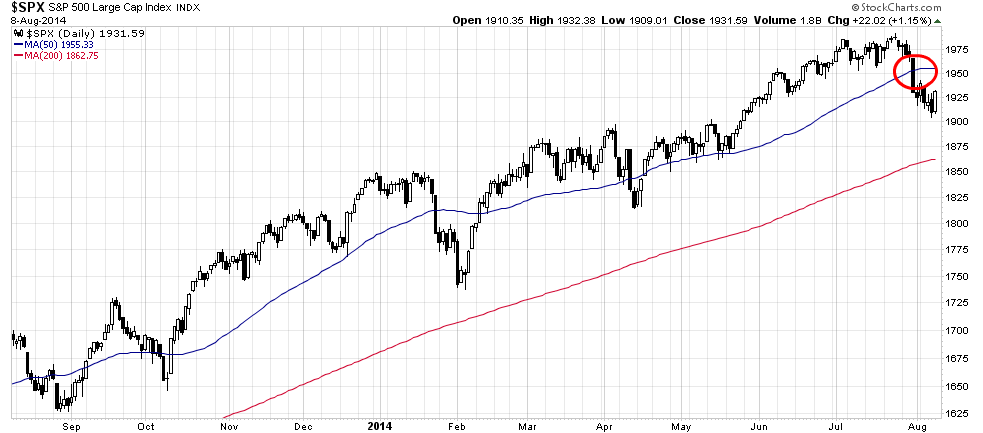
Consider, for example, this chart of the S&P 500. While the SPX remains above its 200 day moving average (dma), it decisively broke down below its 50 dma. At best, the SPX can be ranked as "neutral".
The technical conditions of the European markets look far worse. This chart of the ESTOXX 600 shows that it has not only violated the 50 dma, but the 200 dma as well. It seems to be selling off with no sign of stabilization in sight.
The Trend Model was built to analyze markets from a global perspective. The three trading blocs and engines of growth in the world today are the US, Europe and China. While US and European equity market indices tell a great deal about these economies, the Chinese equity market is far less developed and less liquid than any of the major developed market indices. To get a read on China, I rely more on commodity prices.
This chart of the CRB Index shows commodity prices to be in a downtrend. The equal-weighted CRB Index, or CCI, looks even worse than the CRB. That's largely because of the downdraft we are seeing in the agricultural complex.
When you put it all together, the intermediate term picture looks dire. It was the weakness in foreign equity and commodity markets that led me to issue a warning about US equities (see overbought-oversold indicator , which is based on the ratio of stocks above their 50 dma to stocks above their 150 dma, exits from the 0.50 oversold reading, which it did this week, stock prices have tended to rebound.
At the end of last week, the volatile market action left me in somewhat of a quandary. The trend-following models are calling for risk-off, while the short-term sentiment model readings are bouncing all over the place. This left me calling for an unconfirmed risk-on trading signal.
At the time of this writing on Sunday night, ES futures are modestly in the green, which raises the odds of bullish confirmation. Nevertheless, I would like to see some bullish follow-through this coming week before committing to a full, risk-on reading on my trading account.
If readers would like to see the real-time developments of how the signal develops, please follow me on Twitter at @humblestudent. I will be tweeting during the week and try to post updates here.
Fundamentals still positive for equities
- The interest rate environment continues to be benign. Interest rates matter because they affect the discount rate on earnings, or the inverse of the P/E ratio. With U.S. 10-YearTreasury yields at 2.4%, what is there to complain about?
- We have seen sold reports from the current Earnings Season. The earnings beat rate has been between 67% and 73%, depending which sample you are looking at, and the revenue beat rate has also been above the historical average. Analysis from Factset indicating that the market was not rewarding earnings beats Brian Gilmartin reports that "The year-over-year (y/y) growth rate of the forward estimate fell to 9.53%, from last week’s 9.58%", which is a possible concern that growth expectations are coming down and this development needs to be watched.
- The near term economic growth outlook remains positive. Consider, for example, the steady fall in weekly unemployment claims. New Deal Democrat agrees, though he believes that longer term storm clouds may be on the horizon:
Growth for the rest of 2014, and early 2015, looks intact. But weakness in the housing market evident in the first part of this year may be spreading into the rest of the economy, suggesting that growth will slow down.
Plain and simple, they are shifting their allocations toward a world of faster economic growth and higher volatility. Not all at once, and not severely, but definitely. It’s happening.This explains the bludgeoning of the consumer staples sector last week – its worst sell-off since the late-May Taper Tantrum of 2013. Consumer staples are the perfect stocks for slow growth and low yields – as they offer consistency of earnings regardless of cyclicality and higher than average dividends. In a higher-rate, more pro-cyclical environment, they are not so perfect – especially given their current high valuation. And so they are under distribution so long as economic news – like last week’s record post-crisis ISM report – continue to roll out.
Which brings me to the junk bond sell-off, another symptom of our awaking to the possibility of faster growth. It’s been a pretty orderly sell-off for the $1.6 trillion high yield market, but quite steady and relentless all the same. Why? In a higher rates environment – if ever such a thing should come about – investors are going to demand more return for the risks they’re taking in the asset class. Defaults have been almost non-existent, so the popularity of high yield bonds in investor asset allocations is perfectly understandable. But higher rates have a tendency of disturbing this placidity like a skipped stone across the surface of a pond. And so $5 billion has come out of high yield funds in July, including the highest one-week redemptions in more than a year. Once again, this is the Big Money preparing for something new.
Now, you may be asking, why, if large groups of investors are preparing for higher rates, are rates actually declining – as evidenced by the near record-low yields we saw in the 10-year Treasury last week?
This is a great question, I’m glad you asked.
My theory is that the activity and jostling for position inherent in a market regime shift like the one we’re now seeing is guaranteed to cause volatility. Elephants cannot play musical chairs, even slowly, without some degree of breakage and collateral damage. Nor can large pools of invested capital switch themselves around in complete silence.
Is this move in the junk bond market a hiccup, or the start of something big? I’m open to other opinions, but for it to be something big, you have to have a lot of things that look misfinanced. Where are there economic entities with short-term debt financing long term assets that look overvalued? Where have debts grown the most? I can’t identify a class like that unless we try student loans, or government debts. Corporate debt has grown, but doesn’t seem unreasonable now.So, with high yield, I lean toward the hiccup. But even at current yields, it is not cheap. Speculators may play; I will stay away.
Trading in financial instruments and/or cryptocurrencies involves high risks including the risk of losing some, or all, of your investment amount, and may not be suitable for all investors. Prices of cryptocurrencies are extremely volatile and may be affected by external factors such as financial, regulatory or political events. Trading on margin increases the financial risks.
Before deciding to trade in financial instrument or cryptocurrencies you should be fully informed of the risks and costs associated with trading the financial markets, carefully consider your investment objectives, level of experience, and risk appetite, and seek professional advice where needed.
Fusion Media would like to remind you that the data contained in this website is not necessarily real-time nor accurate. The data and prices on the website are not necessarily provided by any market or exchange, but may be provided by market makers, and so prices may not be accurate and may differ from the actual price at any given market, meaning prices are indicative and not appropriate for trading purposes. Fusion Media and any provider of the data contained in this website will not accept liability for any loss or damage as a result of your trading, or your reliance on the information contained within this website.
It is prohibited to use, store, reproduce, display, modify, transmit or distribute the data contained in this website without the explicit prior written permission of Fusion Media and/or the data provider. All intellectual property rights are reserved by the providers and/or the exchange providing the data contained in this website.
Fusion Media may be compensated by the advertisers that appear on the website, based on your interaction with the advertisements or advertisers.