Santa Claus Rally? Not So Fast
Dr. Duru | Dec 03, 2015 04:23AM ET
T2108 Status: 45.8%
T2107 Status: 33.6%
VIX Status: 15.9
General (Short-term) Trading Call: neutral
Active T2108 periods: Day #42 over 20%, Day #41 over 30%, Day #12 over 40% (overperiod), Day #1 below 50% (underperiod), Day #16 under 60%, Day #356 under 70%
Commentary
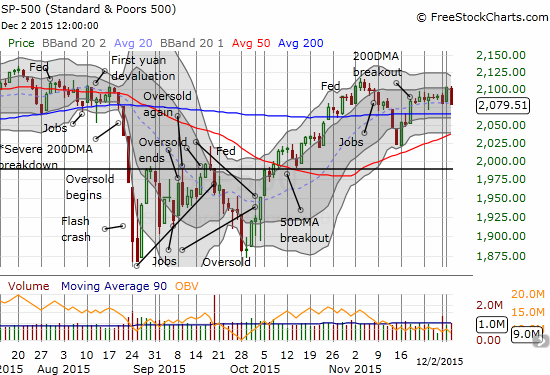
In the last T2108 Update, I noted how the market’s strength at the time seemed to run contrary to a host of other bearish signals. That surprising strength continued to start trading for December when the S&P 500 (SPDR S&P 500 (N:SPY)) launched for a 1.1% gain. The close represented a breakout above a very tight range of churn that held the index in place for 7 trading days. Yesterday, December 2, the S&P 500 perfectly reversed all those gains and brought bearish highlights back into prominence.
First, note in the chart below how all the trading action continues to unfold neatly, right on top of the 20-day moving average (DMA).

The S&P 500 reversed a strong start to December trading but still sits neatly above support at its 20-day moving average (DMA)
If the S&P 500 had closed below its 20DMA, I would have added a “bearish shade” to my neutral short-term trading call. Still, I am wary. Thanks to my favorite technical indicator, T2108, the percentage of stocks trading above their respective 40DMAs, I know that the past two trading days are not the mirror images they appear to be in the chart of the S&P 500.
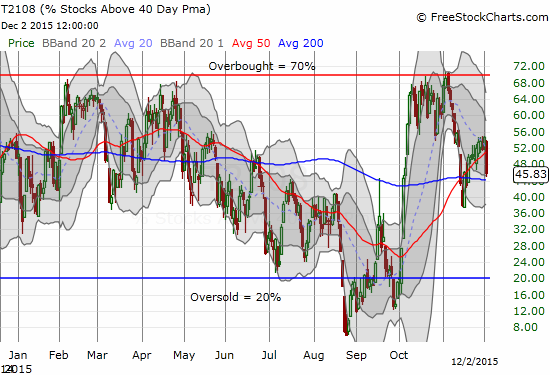
T2108 barely budged on the index’s 1.1% rally. Yesterday’s 1.1% reversal exacted a HEAVY toll on T2108 as it dropped from 54.7% to 45.8%. In other words, this notable setback signaled poor market breadth. Stocks broadly participated in the selling but NOT in the buying. Such behavior signals the kind of poor breadth that can precede larger sell-offs once buyers tire of the same few select winning/trending stocks.

T2108 exhibited a very imbalanced response to the buying and selling that left the S&P 500 flat for the first two days of December.
The Volatility Index, the VIX, added a bit to the alarm by closing above the 15.35 pivot line. The main trading signal comes when the VIX separates from this pivot line.
The volatility index has churned around the important 15.35 pivot for 8 trading days now.
When December jumped to such a roaring start, celebrations seemed in order. I even saw headlines breathlessly speculating on an early start to the seasonal “Santa Claus” rally. The reversal says “not so fast.”
However, bears cannot get overly excited either. December tends to be one of the least risky months of the year based on maximum drawdowns. Here is a telling chart from a piece I wrote in November, 2014. December has the LOWEST average maximum drawdown of any month in the year.
2014’s October drawdown made up for below average drawdowns in the S&P 500’s two other “most dangerous” months
The S&P 500 once again survived its most dangerous months of the year. This time the recovery came in rapid order in October. The index is now sitting on a 1.0% year-to-date gain. This year seems to set to defy the January barometer just as I predicted earlier this year. But it will be a close call. There are several important market events coming this month including an OPEC meeting and a likely rate hike from the Federal Reserve which could swing markets wildly. I am expecting profitable trades on BOTH to the upside and the downside before this month settles into the relative calm of the Christmas season. As always, I will take this one step at a time. Let’s see how the market responds to the current setback.
I conclude with one chart: CSX Corporation (N:CSX), one of America’s major railroads.
CSX Corporation (CSX) plunges back into 50DMA support after reducing its guidance for earnings in 2015.
I ended up buying call options as a play on 50DMA support. This was BEFORE I saw what was happening to T2108 on the day…
Daily T2108 vs the S&P 500
Black line: T2108 (measured on the right); Green line: S&P 500 (for comparative purposes)
Red line: T2108 Overbought (70%); Blue line: T2108 Oversold (20%)
Weekly T2108
Be careful out there!
Full disclosure: no positions, long CSX call options
Trading in financial instruments and/or cryptocurrencies involves high risks including the risk of losing some, or all, of your investment amount, and may not be suitable for all investors. Prices of cryptocurrencies are extremely volatile and may be affected by external factors such as financial, regulatory or political events. Trading on margin increases the financial risks.
Before deciding to trade in financial instrument or cryptocurrencies you should be fully informed of the risks and costs associated with trading the financial markets, carefully consider your investment objectives, level of experience, and risk appetite, and seek professional advice where needed.
Fusion Media would like to remind you that the data contained in this website is not necessarily real-time nor accurate. The data and prices on the website are not necessarily provided by any market or exchange, but may be provided by market makers, and so prices may not be accurate and may differ from the actual price at any given market, meaning prices are indicative and not appropriate for trading purposes. Fusion Media and any provider of the data contained in this website will not accept liability for any loss or damage as a result of your trading, or your reliance on the information contained within this website.
It is prohibited to use, store, reproduce, display, modify, transmit or distribute the data contained in this website without the explicit prior written permission of Fusion Media and/or the data provider. All intellectual property rights are reserved by the providers and/or the exchange providing the data contained in this website.
Fusion Media may be compensated by the advertisers that appear on the website, based on your interaction with the advertisements or advertisers.