A Longer Perspective In Russell 2000
Gregory W. Harmon | Dec 26, 2013 09:26AM ET
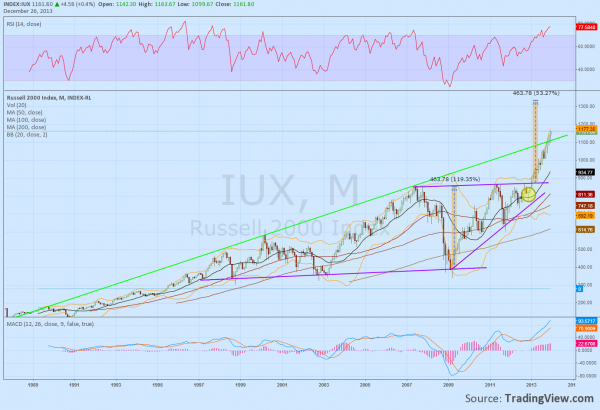
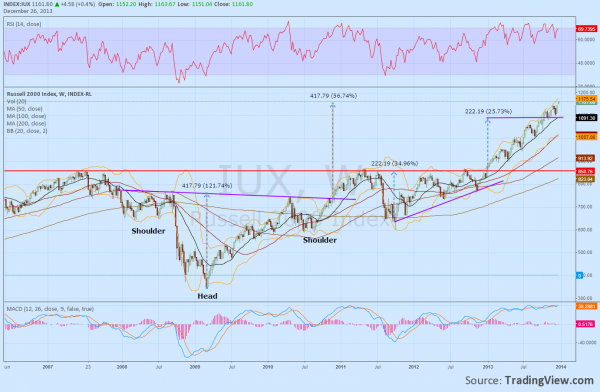
But there are also signs that the move may be running out of steam. The Relative Strength Index (RSI) is at 77, in technically overbought territory, and above levels where it has corrected from in 1994, 1996, 1998, 2000 and 2007. This does not mean it cannot go higher or that it cannot correct by moving sideways. A pullback is not a certainty. The MACD is rising and looks strong, but it is at levels it has not seen before. So the trend is higher but with potential for some reversal. This requires a shift to the weekly timeframe to look for clues for the next few months. It does not show the overbought condition that was prevalent in the monthly chart. It does show some incentive for a pause though. There was an Inverse Head and Shoulders pattern that broke the neckline in November 2010. After retesting the 2007 high and a
The recent consolidation over 1100 can also be explained by the Index reaching the target of the ascending triangle break from January 2013. But the Simple Moving Averages (SMA) unmistakably show that the trend is strong and higher. All are rising parallel and below the Index. A pullback on this timeframe does not look imminent. The daily chart also looks strong and the chart below highlights the trend since the November 2012 bottom. The 50 day SMA has been acting as support with the occasional retreat to the 100 day SMA. The tight crossing jumble of SMA’s acted as a catalyst in December 2012 to ignite the rally and it has had an ebb and flow to it. This created a rising trendline resistance which it is touching now. A pullback is not unexpected here,
On the monthly chart that would be barely measurable. But it would retest the support of the last consolidation following the triangle breakout on the weekly chart. So failure could crescendo lower to 1000 or lower. To keep moving higher it would be healthier for the Index to move sideways for a while or to have a small pullback, like to 1100 or 1000. That does not mean it will. The charts suggest that this rally is going to continue but the caution flags are rising up the flag pole for some sort of a slowdown or pullback.
Trading in financial instruments and/or cryptocurrencies involves high risks including the risk of losing some, or all, of your investment amount, and may not be suitable for all investors. Prices of cryptocurrencies are extremely volatile and may be affected by external factors such as financial, regulatory or political events. Trading on margin increases the financial risks.
Before deciding to trade in financial instrument or cryptocurrencies you should be fully informed of the risks and costs associated with trading the financial markets, carefully consider your investment objectives, level of experience, and risk appetite, and seek professional advice where needed.
Fusion Media would like to remind you that the data contained in this website is not necessarily real-time nor accurate. The data and prices on the website are not necessarily provided by any market or exchange, but may be provided by market makers, and so prices may not be accurate and may differ from the actual price at any given market, meaning prices are indicative and not appropriate for trading purposes. Fusion Media and any provider of the data contained in this website will not accept liability for any loss or damage as a result of your trading, or your reliance on the information contained within this website.
It is prohibited to use, store, reproduce, display, modify, transmit or distribute the data contained in this website without the explicit prior written permission of Fusion Media and/or the data provider. All intellectual property rights are reserved by the providers and/or the exchange providing the data contained in this website.
Fusion Media may be compensated by the advertisers that appear on the website, based on your interaction with the advertisements or advertisers.