A Long-Term View On…Volatility
Dragonfly Capital | Dec 27, 2012 01:16AM ET
The words, bad, loss and fear do not show up in this definition from Investopedia. So why is the Volatility Index (VIX) referred to as the Fear Gauge? And what are you supposed to be afraid of anyway?
The daily chart of the VIX for 2012 below shows it traded in a tight range between 13.30 and 27.73. Sure it looks like a monster spike in May but remember that as a statistically derived gauge it cannot go below 0 and is difficult to get below 10, but can rise infinitely. From that perspective 13.30-27.75 is a very low range. And as my friend Adam Warner has pointed out many times this year, it has been overstating the volatility of the market. There has been no fear in the Fear Index in 2012. A closer look at this chart does identify some interesting information, though.
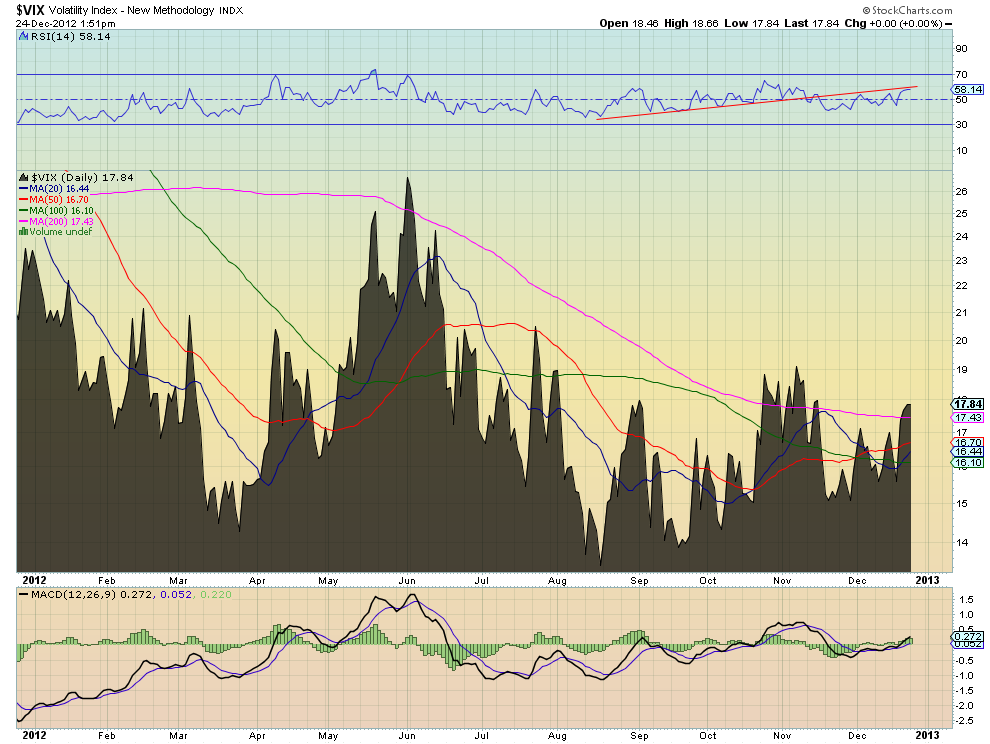
Heading into the end of the year all of the Simple Moving Averages (SMA) have converged into a very tight range between 16.10 and 17.43. There was also a trend higher in the Relative Strength Index (RSI) that has turned from support to resistance in the last month. These signs of complacency may forebode more of the same in the future, or the compressed spring preparing to explode.
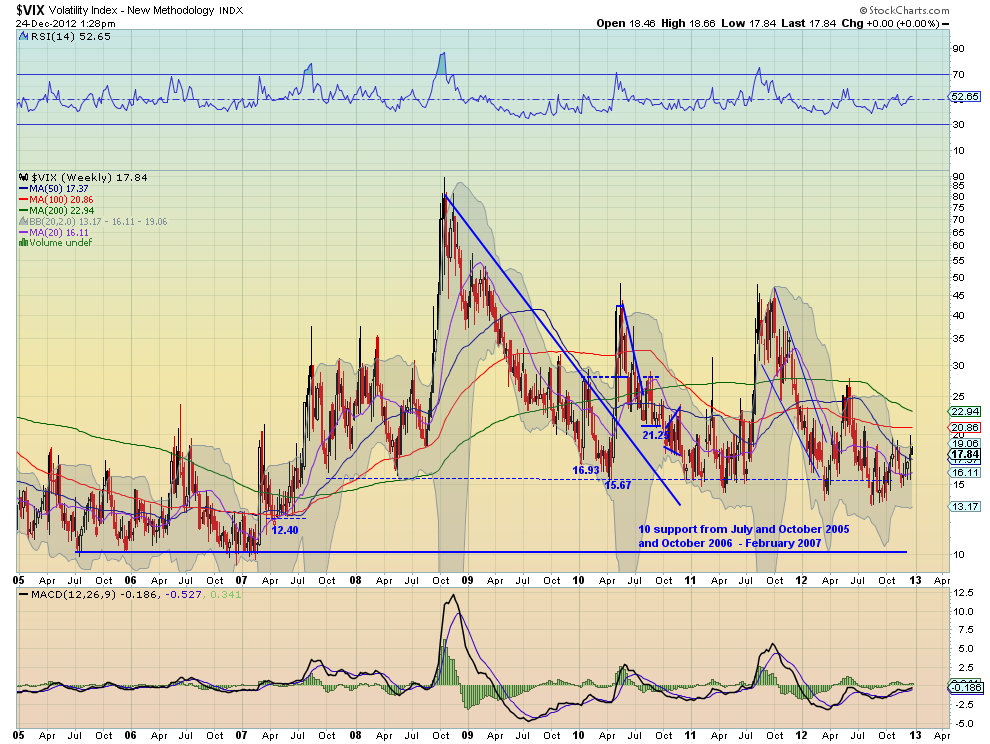
Moving to broader weekly picture below shows that this mellow range is in fact an elevated range compared to the 2005 through 2007 period. Also that the bulk of the time since 2007 the VIX has been within the 15-25 range. The forays above 25 have all been preceded by the RSI on the weekly chart breaking the range higher and the moving Average Convergence Divergence histogram (MACD) moving to positive or also moving out of a range.
There have been warnings. There are no warning signals at the moment but the possibility is there. It is in looking at the monthly chart that gives some perspective. Very near the current levels has been the dividing line between relatively high or low risk environments. The correlation to the S&P 500 also becomes apparent.
The spike in the VIX in 2008 coincided with the stock market crash. During the long bull run from 2003 through 2007 the VIX was low and falling. But during the 1995 to 1999 bull run the VIX was elevated and rising. So a rising VIX does not necessarily mean falling equity prices.
There is one additional piece of information that can be gleaned from this chart. First, the period from 2000 to 2003 shows that it was not a spike in volatility that should be feared but a spike in the volatility of volatility. That is not present today. What does all this mean? Several things.
First, if you want to hedge your portfolio risk by buying the VIX, you are likely gambling with no real edge. Sell S&P Futures or buy S&P Puts instead. Second, the VIX is low, but it can get and stay a lot lower. Just because it is in the teens does not mean the next move is higher. Third, there is no clear future direction jumping out of these charts so expect more of that going into 2013.
Disclaimer: The information in this blog post represents my own opinions and does not contain a recommendation for any particular security or investment. I or my affiliates may hold positions or other interests in securities mentioned in the Blog, please see my Original post
Trading in financial instruments and/or cryptocurrencies involves high risks including the risk of losing some, or all, of your investment amount, and may not be suitable for all investors. Prices of cryptocurrencies are extremely volatile and may be affected by external factors such as financial, regulatory or political events. Trading on margin increases the financial risks.
Before deciding to trade in financial instrument or cryptocurrencies you should be fully informed of the risks and costs associated with trading the financial markets, carefully consider your investment objectives, level of experience, and risk appetite, and seek professional advice where needed.
Fusion Media would like to remind you that the data contained in this website is not necessarily real-time nor accurate. The data and prices on the website are not necessarily provided by any market or exchange, but may be provided by market makers, and so prices may not be accurate and may differ from the actual price at any given market, meaning prices are indicative and not appropriate for trading purposes. Fusion Media and any provider of the data contained in this website will not accept liability for any loss or damage as a result of your trading, or your reliance on the information contained within this website.
It is prohibited to use, store, reproduce, display, modify, transmit or distribute the data contained in this website without the explicit prior written permission of Fusion Media and/or the data provider. All intellectual property rights are reserved by the providers and/or the exchange providing the data contained in this website.
Fusion Media may be compensated by the advertisers that appear on the website, based on your interaction with the advertisements or advertisers.