8 Charts That Tell Where The Stock Market Goes Next
Michael Kramer | Jan 13, 2019 06:24AM ET
The stock market is in a precarious spot. In some cases, it is relatively easy to argue that stocks could rise or fall sharply from their current levels. It was just the other day I thought we could be on the cusp of a significant global stock market rally. But then yesterday, I noted that a storm could be brewing, because of a bearish pattern potentially forming in the housing sector. The stock market is sure hard to read these days.
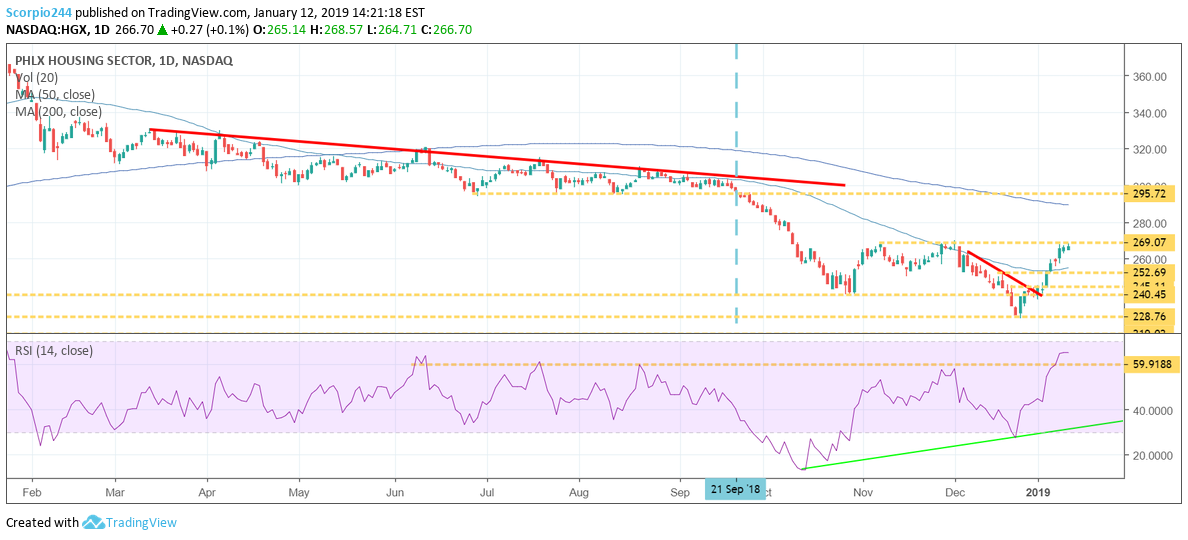
When we dig a bit deeper into the housing index, HGX, we can see a couple of interesting points. They suggest the index is on the verge of a breakout and not likely to form that horrible bearish triple top pattern I mentioned yesterday.
Housing
First, the PHLX Housing (HGX) chart does show there is a substantial level of resistance at 269, which is the cause for my concern. But when we look closely at the relative strength index (RSI) below, we can also see the RSI is now trending higher, which is the first positive sign. The second positive sign is that RSI has yet to reach overbought levels of 70 or higher. The third positive sign is that the RSI appears to be breaking out and is rising above a level of resistance at 60.

S&P 500
The S&P 500 shows how close the index is to breaking out, and 2,630 is the critical level to watch. Again the setup for the RSI points to a bullish formation. The index reached very oversold levels dipping below 30 two times in December. Additionally, the RSI has been in a long-term downtrend since January when it reached severely overbought levels well above 70.
If the RSI can rise above 60 it would signal a breakout. Should that happen it would be the start of a new upward trend for the index and broader market.

NASDAQ
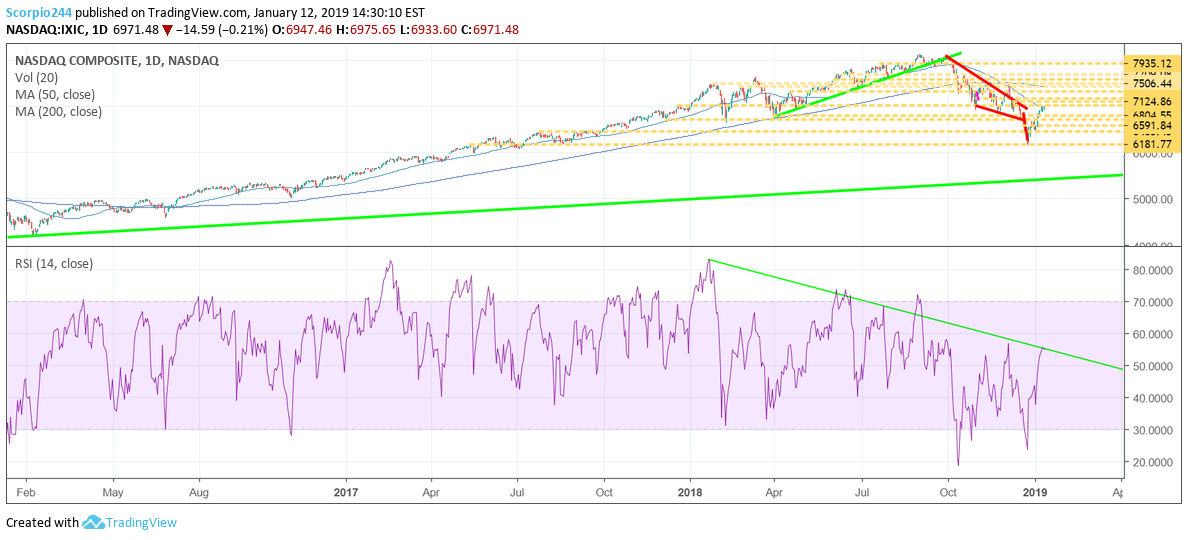
When we look at the NASDAQ Composite composite we can see something similar happening with the RSI. However, in this case it is even close to breaking out.

Semiconductor
iShares PHLX Semiconductor (NASDAQ:SOXX) stocks are also flashing positive signs which would suggest higher prices are likely on the way. The PHLX Semiconductor index is nearing a potential break out from a downtrend. It could send the index on to around 1,270. Additionally, the RSI is also flashing bullish signs as it tries to break free of a long-term downtrend.
International Markets
Hong Kong
Hang Seng is an example of an international index that is in the process of breaking out, having increased above resistance at 26,200. The chart suggests the index could go on to rise towards 27,400. The RSI, after months of being flat, has started trending higher in recent weeks and has plenty of room to rise before reaching overbought levels at 70.
Together both would indicate that stocks in Hong Kong can rise further.
Tencent
A very bullish stock in Hong Kong is Tencent (700 HK). It is on the verge of a big breakout at a price of around 333 HKD. Should it breakout it could rise towards 367 HKD in the coming weeks.
South Korea (KOSPI)
Korea is also pointing to higher equity prices, with the formation of bullish divergence. In this case, the RSI has been trending higher since the end of October despite South Korea (KOSPI) retesting the lows. The index could rise to around 2,140, and a break above that level sends the index even higher trying to fill the gap at 2,220.
German (DAX)
The German (DAX) managed to find support around 10,400. The chart doesn’t look as hot as the others, but there is potential for the index to rise. I think it can work its way towards 11,500. The RSI is consolidating nicely and looks like it is ready for a breakout.
Despite some uncertainty for the stock market over the next few days, the longer-term outlook taking shape seems to be positive.
To ignore the warning signs is not the right thing to do. That is why you need to always be on the lookout. Which is what I try my hardest to always do!
Trading in financial instruments and/or cryptocurrencies involves high risks including the risk of losing some, or all, of your investment amount, and may not be suitable for all investors. Prices of cryptocurrencies are extremely volatile and may be affected by external factors such as financial, regulatory or political events. Trading on margin increases the financial risks.
Before deciding to trade in financial instrument or cryptocurrencies you should be fully informed of the risks and costs associated with trading the financial markets, carefully consider your investment objectives, level of experience, and risk appetite, and seek professional advice where needed.
Fusion Media would like to remind you that the data contained in this website is not necessarily real-time nor accurate. The data and prices on the website are not necessarily provided by any market or exchange, but may be provided by market makers, and so prices may not be accurate and may differ from the actual price at any given market, meaning prices are indicative and not appropriate for trading purposes. Fusion Media and any provider of the data contained in this website will not accept liability for any loss or damage as a result of your trading, or your reliance on the information contained within this website.
It is prohibited to use, store, reproduce, display, modify, transmit or distribute the data contained in this website without the explicit prior written permission of Fusion Media and/or the data provider. All intellectual property rights are reserved by the providers and/or the exchange providing the data contained in this website.
Fusion Media may be compensated by the advertisers that appear on the website, based on your interaction with the advertisements or advertisers.