30-Year Bonds On The Move
Candy Matheson | May 19, 2017 06:30AM ET
Further to my post of April 11, 30-Year Bonds have gained a couple of points, as shown on the monthly chart below.
Price now sits just above major resistance (50% Fibonacci retracement) and is poised to begin reversing the steep plunge that began in mid-2016.
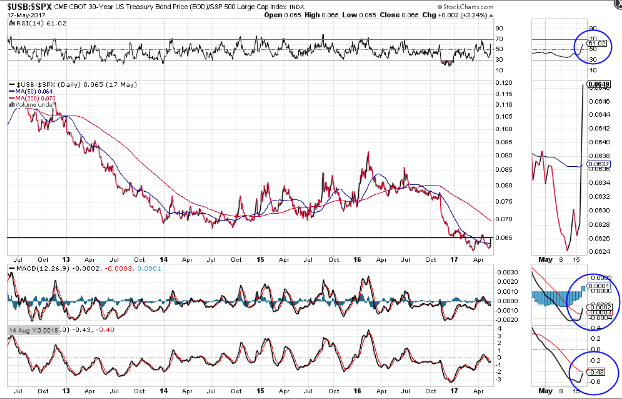
Furthermore, price has now broken above the 50-day moving average of the USB:SPX ratio and is currently at the major resistance level of 0.65, as shown on the daily ratio chart below.
Inasmuch as we're close to seeing a new "BUY" signal form on all 3 technical indicators, I'd keep an eye on this ratio to determine its strength versus equities in the coming days/weeks (particularly, in light of my comments of May 18), especially, if it breaks and holds above 0.65. If it does, its next target would be the 200-day moving average at 0.70.
As an aside, I'd add that, in the midst of the current political chaos emanating from the White House, President Trump may end up remaining in power for 4 years. However, if in the meantime, he's widely regarded by domestic and foreign political players, as well as the American public, as untrustworthy (in spite of future facts and conclusions reached on current political and intelligence investigations), his tenure could very well end up being unremarkable and devoid of any major accomplishment.
In that kind of environment, this would NOT be a wagon that equity markets could confidently hook up to in a sustainable way, without the risk of accompanying high volatility, in my opinion.
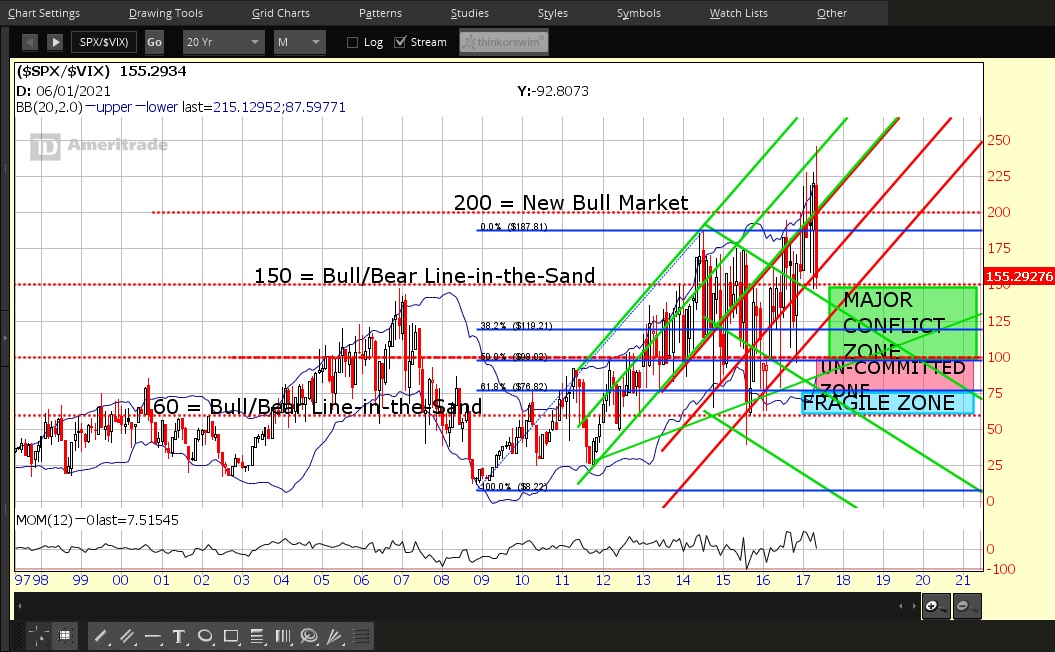
In this regard, watch for a break and hold below the 150 major support level on the SPX:VIX ratio, as well as a drop and hold below zero on the Momentum indicator, as shown on the monthly ratio chart below.
In that case, volatility will remain elevated and we'll see larger intraday and overnight equity swings.
Trading in financial instruments and/or cryptocurrencies involves high risks including the risk of losing some, or all, of your investment amount, and may not be suitable for all investors. Prices of cryptocurrencies are extremely volatile and may be affected by external factors such as financial, regulatory or political events. Trading on margin increases the financial risks.
Before deciding to trade in financial instrument or cryptocurrencies you should be fully informed of the risks and costs associated with trading the financial markets, carefully consider your investment objectives, level of experience, and risk appetite, and seek professional advice where needed.
Fusion Media would like to remind you that the data contained in this website is not necessarily real-time nor accurate. The data and prices on the website are not necessarily provided by any market or exchange, but may be provided by market makers, and so prices may not be accurate and may differ from the actual price at any given market, meaning prices are indicative and not appropriate for trading purposes. Fusion Media and any provider of the data contained in this website will not accept liability for any loss or damage as a result of your trading, or your reliance on the information contained within this website.
It is prohibited to use, store, reproduce, display, modify, transmit or distribute the data contained in this website without the explicit prior written permission of Fusion Media and/or the data provider. All intellectual property rights are reserved by the providers and/or the exchange providing the data contained in this website.
Fusion Media may be compensated by the advertisers that appear on the website, based on your interaction with the advertisements or advertisers.