25% Recession Probability In The Next 6-12 Months
Hale Stewart | Sep 18, 2019 07:38AM ET
Summary
The purpose of the Turning Points Newsletter is to look at the long-leading, leading, and coincidental economic indicators to determine if the economic trajectory has changed from expansion to contraction -- to determine if the economy has reached a "Turning Point."
My recession probability in the next 6-12 months is 25%. There are two reasons for this.
1.) Corporate sector softness: heightened policy uncertainty has stalled capital investment projects, which has lowered demand for non-transport durable goods. This has slowed the US manufacturing sector, dropping industrial production. Manufacturers have responded by cutting the total hours worked during the week and slowing hiring
2.) The yield curve is still inverted, a topic which I delve into this week.
This week, there was little new information on key indicators. So, I wanted to use this lull to take a deep dive into the credit markets because they comprise a fairly large portion of the important indicators.
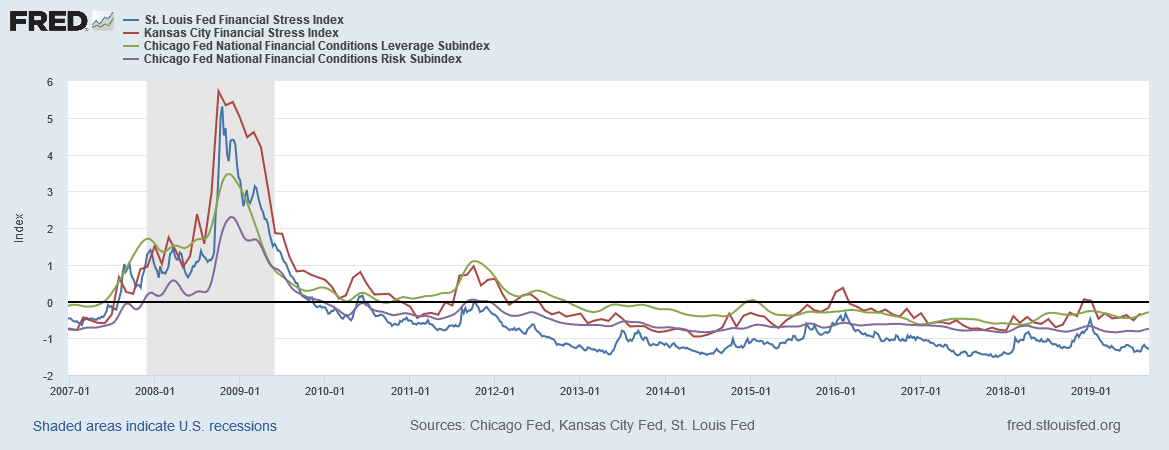
Let's start with several overall measures of credit market risk:

Above are the Kansas City and St. Louis Financial Stress indexes along with two sub-components of the Chicago Fed's National Financial indexes. All are at low levels. The chart contains information from before the last recession showing that all of these indicators have previously picked-up before a recession. Typically, the credit markets begin to experience some level of stress before a recession. That simply isn't happening right now.

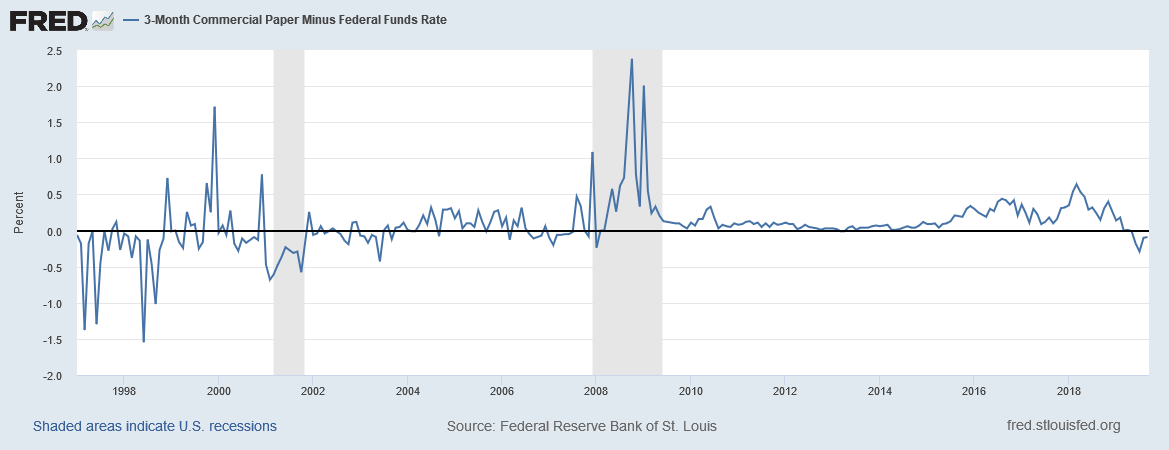
Above is a chart of the 3-month commercial paper rate minus the Federal Funds rate. While this doesn't have to spike during a recession (see the early 2000s experience), it is used as a measure of risk (see the data from the last recession). Right now, there is no issue in this market either.
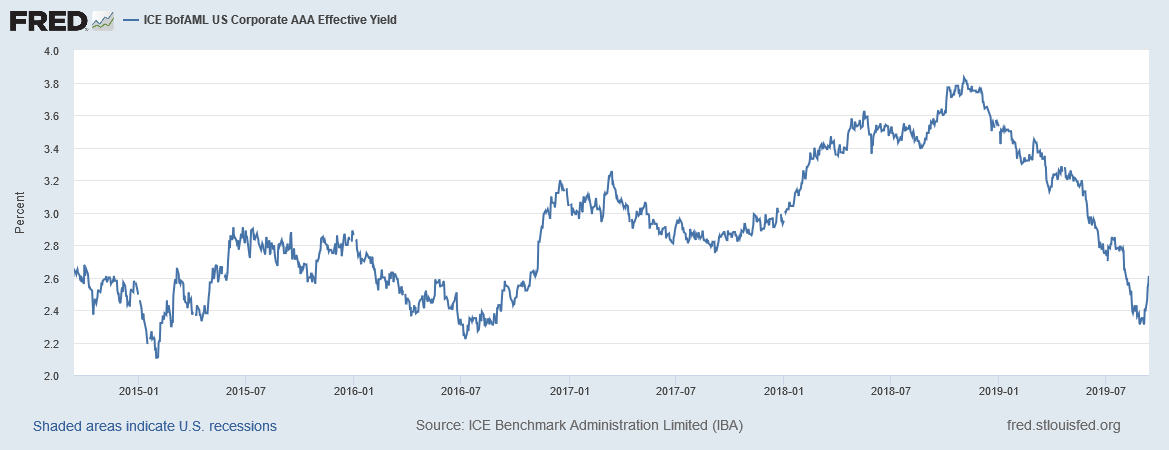
Corporate rates are also very low.

The AAA rate declined from 3.8% to 2.4% between 4Q18-2Q19. While it spiked over the last week, that could simply be profit-taking. Regardless of the reason, it's only one data point from one week.
BBB rates have also declined, falling from 4.8% in the 2H8 to 3.2% a few weeks ago.
While junk bond rates are elevated -- the started to fluctuate right below the 12.5% level at the end of 2018 -- that is hardly a cautionary level for high-yield bonds. The experience during the oil market recession of 2015-2016 is illustrative. Then, energy market debt sold off sharply, sending junk yields over 20%. Current rates are far more contained, which means there is still a fair amount of liquidity in the market.
And that leads to a discussion of these two key Treasury market graphs:
The 10-Year/3-Month spread has moved progressively lower over the last five years, eventually contracting during the summer. Last week, the bond market sell off sent yields back towards positive territory.
Above are two charts of the spread in the belly of the curve. The left chart shows the 10/7/5-year/3-month spreads while the right chart shows the 7/5/3-year/1-year spreads. The former contracted during the Spring while the latter contracted at the end of last year.
There are two competing narratives explaining the Treasury market situation. The first is more traditional -- that a yield curve inversion is a harbinger of a recession, or at least slower growth. This is espoused by Dallas Fed President Kaplan (emphasis added; from early June):
I am closely monitoring the shape of the yield curve in the U.S. The three-month Treasury yield is today at 2.12 percent. In my view, the one-year Treasury at 1.93 percent, the five-year at 1.77 percent and the 10-year at 2.03 percent are indicative of sluggish expectations for future growth—and recent heightening of trade tensions has likely exacerbated these growth concerns.
St. Louis Fed President Bullard also shares this opinion (from August 6):
There are sound reasons explaining why an inverted curve precedes a recession. Between 1-2 years before a recession, bond investors begin to think the economy will slow, which causes lower inflation. To take advantage of this, they start to buy longer-dated bonds, sending yields lower. There is ample current economic support for this development. Most of the global manufacturing PMIs are contracting; several major economies and economic regions are grinding to growth near 0%; there is a growing trend among central banks to cut rates, all citing international uncertainty as a reason for their actions.
But there is another narrative that is just as popular, which is expressed by Boston Fed President Rosengren (emphasis added):
However, the current situation is somewhat different, in my assessment. Previously, most of the yield curve inversions were driven by the Federal Reserve raising short-term rates well above the level expected to prevail in the long run, in order to slow the economy down and prevent inflation from accelerating. Today, the short-term interest rate that the Federal Reserve targets, the federal funds rate, is at a level roughly equal to our 2 percent inflation target and still below its expected level in the long run. Rather than policy actions by the Fed that raise the short-term rate, what is currently driving the yield curve inversion is the decline in the longer-term rate.
The depressed long-term yield, in part, reflects the challenging economic conditions in much of the rest of the world. Currently, U.S. government bond yields (determined, of course, in the marketplace, not set by policymakers) are higher than those in most other developed countries. This provides an incentive for foreign investors to buy U.S government securities, especially if the risk of a dollar depreciation is perceived as low. But such an increase in demand pushes the prices of U.S. government securities up, and yields down.
This is also a viable explanation for the US yield curve inversion. Japanese and German bonds are trading at negative yields; the EU just lowered its key rate an additional 10 basis points, taking it further into negative territory. With the US offering far higher yields (relatively speaking), they are bound to catch a bid, sending yields lower.
The financial press and analysts are treating these explanations as an either/or proposition. However, what if both are right? If that's the case, then the yield curve's prediction capabilities are still valid and should still be considered. This supports my 25% recession probability in the next 6-12 months.
Original Post
Trading in financial instruments and/or cryptocurrencies involves high risks including the risk of losing some, or all, of your investment amount, and may not be suitable for all investors. Prices of cryptocurrencies are extremely volatile and may be affected by external factors such as financial, regulatory or political events. Trading on margin increases the financial risks.
Before deciding to trade in financial instrument or cryptocurrencies you should be fully informed of the risks and costs associated with trading the financial markets, carefully consider your investment objectives, level of experience, and risk appetite, and seek professional advice where needed.
Fusion Media would like to remind you that the data contained in this website is not necessarily real-time nor accurate. The data and prices on the website are not necessarily provided by any market or exchange, but may be provided by market makers, and so prices may not be accurate and may differ from the actual price at any given market, meaning prices are indicative and not appropriate for trading purposes. Fusion Media and any provider of the data contained in this website will not accept liability for any loss or damage as a result of your trading, or your reliance on the information contained within this website.
It is prohibited to use, store, reproduce, display, modify, transmit or distribute the data contained in this website without the explicit prior written permission of Fusion Media and/or the data provider. All intellectual property rights are reserved by the providers and/or the exchange providing the data contained in this website.
Fusion Media may be compensated by the advertisers that appear on the website, based on your interaction with the advertisements or advertisers.