2021 Dow Crash More Violent Than 2020
Sid Klein | Feb 19, 2021 03:15AM ET
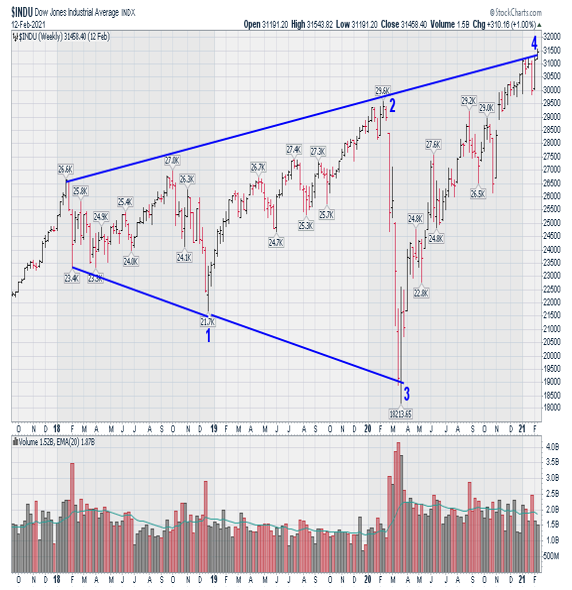
This year’s crash will be more violent than 2020’s debacle, based on 2 technical observations that we may glean from the 3-year weekly Dow chart below.
- An expanding triangle connotes increasing volatility and danger. When such a triangle follows a bullish phase, point #5 is the lowest. In today’s case, a new low would take the Dow to a level below 18,000. Based on historic relationships, one may consider the 15,500 – 16,500 zone as the best guess for where the expanding triangle’s point-5 will land.
- To not clutter the chart with annotations, I have not included my Elliott Wave interpretation for the 2020 - 2021 period. Simply, last year’s low, which relates to the number 3 within the expanding triangle (see chart below), also marked Wave-A within and A-B-C decline. This interpretation suggests that the Wave-B peak is nearby.
Note: This is the most dangerous of all corrections, since Wave-B is allowed to exceed the preceding bull market’s Wave-5. The rule in Elliott is that, in such corrections, Wave-C should then be the fastest. This would suggest that this year’s decline will be even faster than what we saw in 2020, and greater in terms of points, once also considering the expanding triangle.
Finally, if the distance between points 1 and 3 will have been the same as points 3 and 5, the greatest crash of all times will be complete by - July 1, 2021.
There is no such rule regarding time periods being equidistant, however. I am simply embellishing for market timers who wish to leverage any get-rich-quick schemes.
In August 2019, I cautioned that history was repeating itself and that the Dow could either commence declining, or continue up through to yearend before crumbling, therefore.
In the end, the Dow moved up into February 2020, before crashing 10,000 points as forecast in 4 reports published between December 2019 - February 2020 (the reports also forecast that silver would rally $10 from the 2019 low).
In the August 2019 report, I advised having a strategy that could benefit from a continued advance, but which could profit mightily from a sharp bear decline.
This strategy fit the market analysis at the time. Every report that followed advised maintaining that strategy. I continued forecasting, but focused on the strategy more than market timing, hence the stretch of time that has passed since my previous report.
In other words, since it remains a matter of importance for market timers, I only come out of the woodwork to write something when an extreme level of importance appears to be in front of us. Still, I stress the strategy, the outline of which I gave in the special section at the beginning of last March’s report.
As for gold and silver, gold’s weakness and silver’s strength are actually correlated, as $40 silver is being correctly forecast among those who, also correctly, are analyzing that money is coming out of gold and flowing into the barely-liquid silver, comparatively-speaking.
Last year’s report also identified the perfect peak in the century-long gold:silver ratio chart, along with analysis of the effect of even a little bit of money coming out of gold for silver’s benefit. The future arrived, and will continue to do so.
So, there’s my analysis, my plug, my preferred strategy….along with my offering-but-protection of the “secret sauce.”
Good luck to all.
Original Post
Trading in financial instruments and/or cryptocurrencies involves high risks including the risk of losing some, or all, of your investment amount, and may not be suitable for all investors. Prices of cryptocurrencies are extremely volatile and may be affected by external factors such as financial, regulatory or political events. Trading on margin increases the financial risks.
Before deciding to trade in financial instrument or cryptocurrencies you should be fully informed of the risks and costs associated with trading the financial markets, carefully consider your investment objectives, level of experience, and risk appetite, and seek professional advice where needed.
Fusion Media would like to remind you that the data contained in this website is not necessarily real-time nor accurate. The data and prices on the website are not necessarily provided by any market or exchange, but may be provided by market makers, and so prices may not be accurate and may differ from the actual price at any given market, meaning prices are indicative and not appropriate for trading purposes. Fusion Media and any provider of the data contained in this website will not accept liability for any loss or damage as a result of your trading, or your reliance on the information contained within this website.
It is prohibited to use, store, reproduce, display, modify, transmit or distribute the data contained in this website without the explicit prior written permission of Fusion Media and/or the data provider. All intellectual property rights are reserved by the providers and/or the exchange providing the data contained in this website.
Fusion Media may be compensated by the advertisers that appear on the website, based on your interaction with the advertisements or advertisers.