2018 Forecast: Look For Lower S&P 500 Returns
Brian Gilmartin | Dec 18, 2017 10:41AM ET
- The US economy and global GDP growth is accelerating off a slow, post-2008 below-average pace.
- S&P 500 earnings are expected at 10% in 2017 and 11% in 2018 – the best growth since 2011.
- Sentiment is starting to turn relatively bullish. Sometimes ‘the crowd” gets it right as it did between 1995 – 1999. Yet sentiment is often a better contrarian indicator.
- 2017’s S&P 500 forecast: the actual S&P 500 return this year will be 22% – 23%.
- 2016’s S&P 500 forecast: the S&P 500’s return was 12.5% or thereabouts in ’16.
- 2015’s S&P 500 forecast: Didn't make one – Crude oil was tanking – Thought Financials would be best sector in 2015. Instead, Financials finished 5th of the 10 S&P 500 sectors.
- S&P 500 will mean revert to mid-to-high single digits returns
- Tech and Financials will remain the two two sectors in client accounts, with Tech weighting shrinking and Financials weight rising.
- Value, Small-Cap and Consumer Staples will be asset classes and sectors that see some rotation.
- Much of fixed-income money will remain in cash, riding up the money-market yields as the Fed will likely raise rates again in ’18. 1% – 2% returns with no risk represent better risk/reward of 4% – 5% returns with credit risk and duration risk.
Style-box analysis: note the dramatic out-performance of large-cap and Growth this year, mostly driven by Technology:
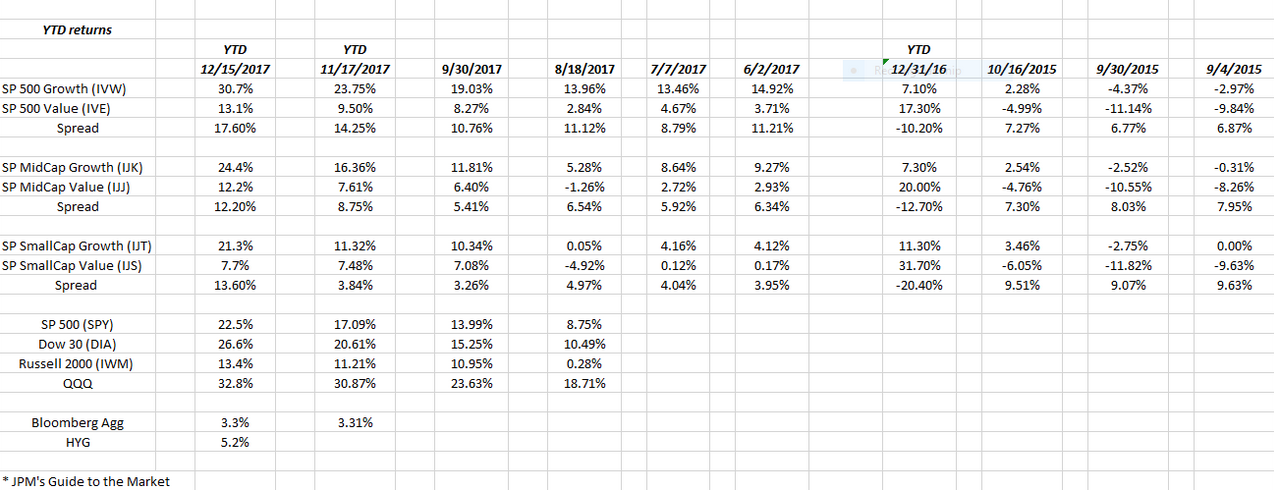
Clients will see rotation into some of the under-performing sectors relative to large-cap and growth.
Our forecasting record the last few years hasn’t been that bad:
Readers should understand:
1.) No one can predict the future accurately and regularly
2.) Most forecasts are likely wrong based on events that cant be foreseen
3.) Readers should take all forecasts and opinions with a healthy dose of skepticism and know that no one person, one firm, one style or one strategy will outperform on a relative or absolute basis at all times.
4.) Simply analyzing the normal distribution of S&P 500 returns since the early 1970s can often get readers pretty close to a decent return forecast for the benchmark. However, was the case between 1995 – 1999, there can be times where returns get completely out of whack with the normal distribution.
We're are still in the early stages of a secular bull market that began in March 2009 or in May 2013 (when S&P 500 traded over March 2000 and October ’07 highs) so there should be plenty of room for the S&P 500 to see higher prices in the next 3 to 5 years. The fact that the S&P 500 hasn’t seen even a 5% correction in the last 24 months does worry me. It wont take much to put a little fear back in the equity markets with an event that comes out of the blue (so to speak). However, just to provide some historical context, in the 1982 – 2000 bull market, there was only one negative year for the S&P 500 in terms of total return, and that was 1990, when Saddam rolled his tanks into Kuwait and crude oil spiked to $39 per barrel.
Sectors To Watch
The value style and small-caps have trailed the S&P 500 this year.
Financial’s are the favored sector into 2018 as names like Charles Schwab (NYSE:SCHW), Goldman Sachs (NYSE:GS), Morgan Stanley (NYSE:MS) and the big banks – and ETFs like XLF – begin to trade over their 2007 highs for the first time in 10 years.
Microsoft (NASDAQ:MSFT) and Schwab have been the top-two holdings in client accounts for several years. That's unlikely to change in 2018 but tactical trades have been made in Tech ETFs to lift the sector weighting so those ETFs will likely be sold first.
If readers are worried about Tech’s strength and out-performance this year, stick with what i call the “Original Gangsters” or the tech stocks from the 1990s that have built 17-year bases. Microsoft broke out to an all-time-high in late 2016. Oracle (NYSE:ORCL) broke out in March 2000 in mid 2017. Oracle is still working out the Cloud but those are two examples of stocks that COULD offer less downside in a real market flush as they have technically traded within their previous range for 17 years.
The bond markets continue to be beyond frustrating. The Bloomberg Barclays (LON:BARC) Aggregate is up 3% – 4% in ’17 with High yield up a bit more. There is little value in these markets that I can see relative to what a whiff of real inflation could do to the markets. And that forecast has been wrong for about 8 years now. Some high-yield ETFs were bought in the crude drawdown in early ’16 but after 6 months, we sold HYG).
Bottom-Line Outlook
Remember:
1.) The above forecast is probably wrong
2.) Adjustments will be made to client accounts as 2018 unfolds
3.) Evaluate your own risk / reward and use forecasts like this blog as a rough guide.
Trading in financial instruments and/or cryptocurrencies involves high risks including the risk of losing some, or all, of your investment amount, and may not be suitable for all investors. Prices of cryptocurrencies are extremely volatile and may be affected by external factors such as financial, regulatory or political events. Trading on margin increases the financial risks.
Before deciding to trade in financial instrument or cryptocurrencies you should be fully informed of the risks and costs associated with trading the financial markets, carefully consider your investment objectives, level of experience, and risk appetite, and seek professional advice where needed.
Fusion Media would like to remind you that the data contained in this website is not necessarily real-time nor accurate. The data and prices on the website are not necessarily provided by any market or exchange, but may be provided by market makers, and so prices may not be accurate and may differ from the actual price at any given market, meaning prices are indicative and not appropriate for trading purposes. Fusion Media and any provider of the data contained in this website will not accept liability for any loss or damage as a result of your trading, or your reliance on the information contained within this website.
It is prohibited to use, store, reproduce, display, modify, transmit or distribute the data contained in this website without the explicit prior written permission of Fusion Media and/or the data provider. All intellectual property rights are reserved by the providers and/or the exchange providing the data contained in this website.
Fusion Media may be compensated by the advertisers that appear on the website, based on your interaction with the advertisements or advertisers.