2015: A Year For Growth Stocks
Blog of HORAN Capital Advisors | Jan 01, 2016 12:49AM ET
The Dow Jones Industrial Average declined 2.2% in 2015, its first negative return year since 2008. The S&P 500 Index fell .7% and the Nasdaq posted a positive 5.7 return for the year. Several interesting phenomenon occurred in 2015: narrow market breadth, strong outperformance of growth stocks versus value stocks and strong performance of the FANGs (Facebook (O:FB), Amazon (O:AMZN), Netflix (O:NFLX) and Alphabet or Google (O:GOOGL)).
- For the year the average return of the FANGs equaled 77.2%.
- Looking at returns a little more broadly, yet highlighting the narrow market leadership, the average return for the top 10 stocks in the S&P 500 Index by market capitalization were up 25.9%, while the average return of the remaining 490+ were down 1.1%.
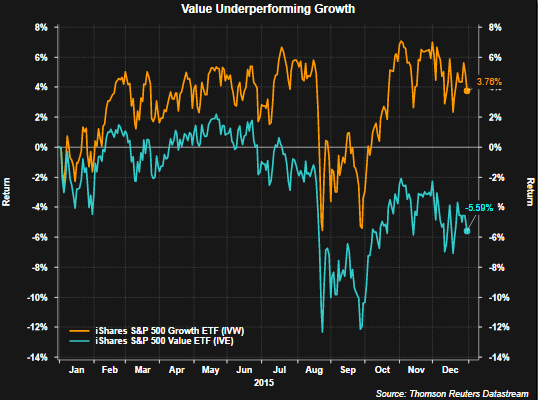
As noted at the beginning of the post, there was a large difference in return of large cap growth and large cap value stocks. The S&P 500 Growth Index was up 3.76% while the S&P 500 Value Index declined 5.59%. The growth and value indices do have overlap in the holdings that comprise each of the index. Some key highlights though:
S&P 500 Growth Index (310 names)
- Average return = 9.1%
- Average all positive returns 20.2% (212 companies)
- Average all negative returns -15.0% (97 companies)
S&P 500 Value Index (367 names)
- Average Return = -8.5%
- Average all positive returns 12.1% (136 names)
- Average all negative returns -20.5% (231 names)
Below is a chart noting the 2015 return (not average return) for each respective index.
S&P Dow Jones Indices does use data to construct indexes for "pure" value and "pure" growth parameters. S&P constructs these indexes with the following parameters in mind:
- Style Index Series: This series divides the complete market capitalization of each parent index approximately equally into growth and value indices, while limiting the number of stocks that overlap between them. This series is exhaustive (i.e., covering all stocks in the parent index universe) and uses the conventional, cost-efficient, market capitalization-weighting scheme.
- Pure Style Index Series: This series is based on identifying approximately one quarter (1/4) of the market capitalization of the index as pure growth, and one quarter (1/4) as pure value. There are no overlapping stocks and stocks are weighted by their style attractiveness.
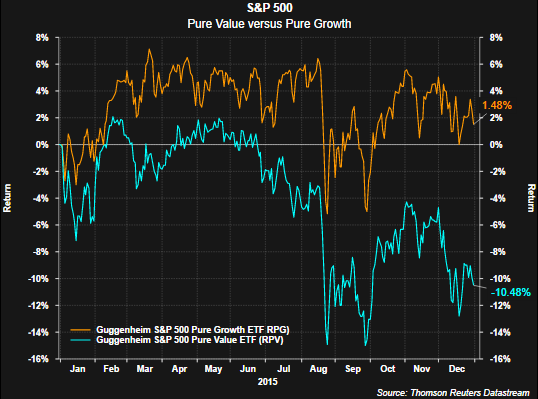
As can be seen in the below chart, the S&P 500 Pure Value Index is down nearly double the S&P 500 Value Index for 2015. The complimentary pure growth index has generated half the return as the S&P 500 Growth Index; however, the absolute magnitude of the difference is not large.
Lastly, the two charts below show the average sector returns for the growth/value and pure growth/pure value styles. Again, because the pure growth and pure value styles eliminate any overlap between the two indexes, the differeing sector returns is clearly visable. For the S&P 500 Pure Value sectors, not one sector has an average return that is positive for 2015. This simply speaks to the significant outperformacne of growth versus value in 2015.
As 2016 gets under way, the significant disparity in growth versus value will be one factor investors will want to evaluate. Value type equities certainly look attractive from a valuation perspective; however, the slow pace of economic growth, both in the U.S. and abroad, have weighed significantly on value stocks. Additionally, energy oriented equities account for three times as many names in the value index and the weak returns in this space have been well written about this year. In the coming week we will have more perspective on our views for 2016.
Trading in financial instruments and/or cryptocurrencies involves high risks including the risk of losing some, or all, of your investment amount, and may not be suitable for all investors. Prices of cryptocurrencies are extremely volatile and may be affected by external factors such as financial, regulatory or political events. Trading on margin increases the financial risks.
Before deciding to trade in financial instrument or cryptocurrencies you should be fully informed of the risks and costs associated with trading the financial markets, carefully consider your investment objectives, level of experience, and risk appetite, and seek professional advice where needed.
Fusion Media would like to remind you that the data contained in this website is not necessarily real-time nor accurate. The data and prices on the website are not necessarily provided by any market or exchange, but may be provided by market makers, and so prices may not be accurate and may differ from the actual price at any given market, meaning prices are indicative and not appropriate for trading purposes. Fusion Media and any provider of the data contained in this website will not accept liability for any loss or damage as a result of your trading, or your reliance on the information contained within this website.
It is prohibited to use, store, reproduce, display, modify, transmit or distribute the data contained in this website without the explicit prior written permission of Fusion Media and/or the data provider. All intellectual property rights are reserved by the providers and/or the exchange providing the data contained in this website.
Fusion Media may be compensated by the advertisers that appear on the website, based on your interaction with the advertisements or advertisers.