12 Charts To Watch In 2022
Callum Thomas | Jan 13, 2022 01:06AM ET
A couple of weeks ago I shared with you some of my Best Charts of 2021 (as well as my Worst Charts of 2021 and then also my favorites!
This week it's time for perhaps one of my most important posts of the year—the charts to watch in 2022! This has become an annual tradition for me, and FYI: I will be checking in quarterly to see how things are going. It adds in a nice little element of accountability and helps keep you up to date with how I'm thinking. Check out last year's post for an example.
These charts were featured in my recently released — check it out (free download as a holiday treat!).
That report and those posts were useful to look at, but as interesting and sometimes amusing as it is to look back, as investors we get paid for looking forward, for understanding and anticipating the evolving risk/return outlook.
For me there’s a few existing trends and themes that will remain front of mind and be key to keep on the radar in 2022. Following is a selection of the key charts and indicators I will be watching in the new year.
Enjoy, and feel free to share the link or charts as you see fit! Also be sure to let me know what you think in the comments...
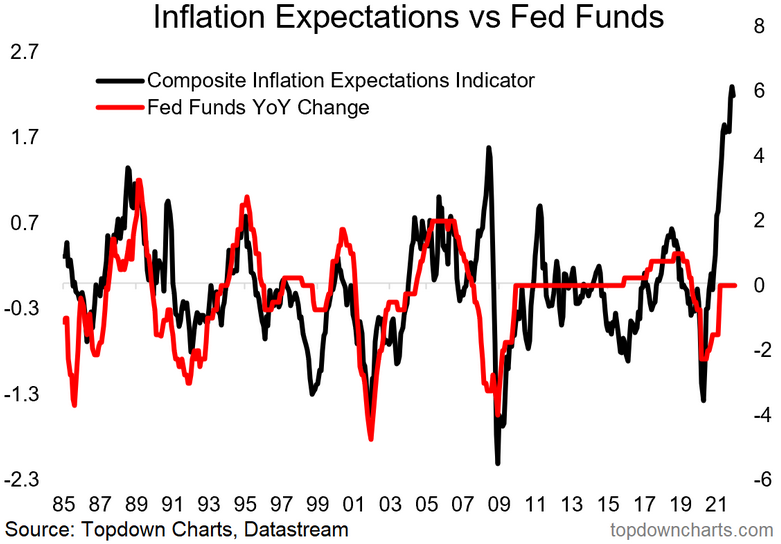
1. Fed Behind The Curve: Based only on this chart we could make an assertion that the Fed has fallen behind the curve. Against that there is the argument that other factors are important too, and not to mention the point that the Fed basically decided to position itself behind the curve to try and prevent the mistake of tightening too soon. With the composite measure of inflation expectations at 40-year highs it’s fair to suggest that the Fed may have some catching up to do as it kicks off the transition away from easing.
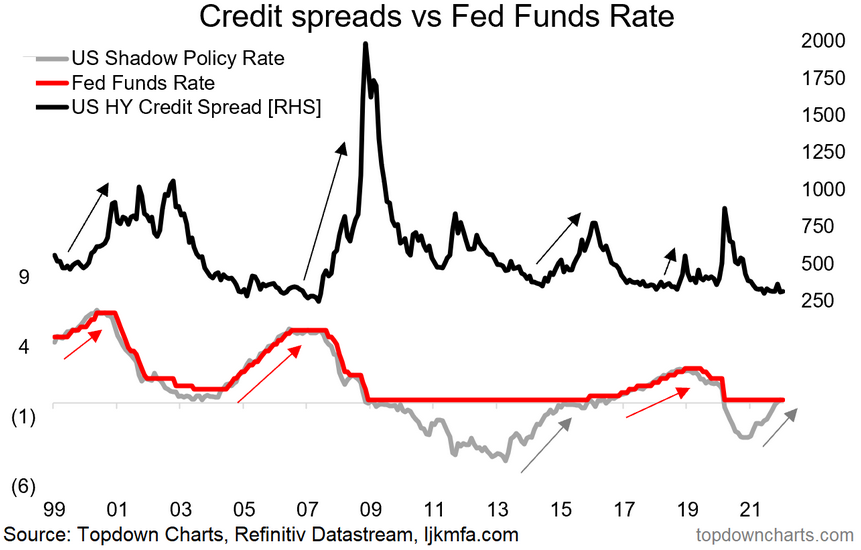
2. Fed Catch-Up Risk: Naturally the Fed now faces another risk—i.e. the risk of being dragged into a game of catch-up in the context of a very complacent market that has arguably come to expect permanent easing... “the Fed has my back.”
Just remember, the old saying of ‘don’t fight the Fed’ means don’t fight against the tides, and the tides are starting to change.
3. Growth Scare 2022: But then again, maybe the Fed won’t even get a chance to get a rate hike out the door if the chart below proves anywhere near accurate. This and a few other leading indicators are pointing to a possible growth scare in 2022. Maybe it will be one-and-done for the Fed? Or maybe any such growth scare only serves to extend the economic expansion further by triggering renewed stimulus. Certainly a risk and a key chart to keep on the radar.
4. Corporate Capex: This chart hints at perhaps one of the most important themes I’ve been talking about over the past year—the prospect of a possible multi-pronged, multi-year investment boom. The chart below highlights the typical cycle leads and lags in terms of capex growth, and with easier funding conditions, booming corporate earnings, and a rebounding economy it’s likely that we see a generalized uplift in capital expenditure.
But as I’ve been highlighting in the reports there are a few particular sectors that are likely to see a surge in investment in response to surging prices–for example, the global shipping sector, and commodity producers. Both of which have seen capex languish for the past decade, and both of which have seen an effective windfall from the pandemic (i.e. surging shipping rates and commodity prices).
5. Capacity Utilization: Another key impetus to resurgent capex is tightening of capacity e.g. measures of labor market capacity utilization are close to pre-pandemic levels. This will put upward pressure on pricing and present an incentive or signal to firms to lift investment.
But it also speaks to the inflation theme. While some of the short-term upward pressures on inflation are likely to pass (e.g. backlogs, base effects, the initial bounce-back), should we see further and sustained tightening of capacity utilization it will put upward pressure on the more core or underlying inflation pulse.
6. Government (and Green) Capex: To really drive it home, the capex/investment theme is not just about corporations responding to economic forces, it’s also about governments responding to the pandemic as well as social/political forces.
Specifically in terms of recovery/rebuilding fiscal programs which in many countries have been targeted at infrastructure. But also climate related infrastructure and investment—something that is definitely part of fiscal packages, but also part of shifting investor preferences. We’ve observed a clear trend of rising financial investment into clean energy sectors being followed by uplift in real investment. So altogether it’s quite interesting.
7. US Absolute vs Relative Valuations: Should all this talk of capex and investment booms come to pass, we’d likely start to see upward pressure on bond yields, and that will put a squeeze on the US equity risk premium.
The chart below is one of my favorites for thinking about US equity valuations. It points out what most of us already know: US equities are expensive in absolute terms …i.e. the PE ratio is really very high. But if we factor in low bond yields then maybe it’s not so bad. At present the chart says absolute valuations are wildly expensive, but relative valuations are ok (for now). That will change if/when bond yields rise—and in that sense it also goes to highlight the interest rate sensitivity of the market if we accept the statement that equities only offer reasonable value in a low yield environment.
8. US Asset Class Valuations: To complicate matters slightly, my valuation metrics show bonds expensive vs history as well—so: “equities look reasonable vs expensive bonds??”. To make matters worse, property prices are also sailing into rarefied air. Commodities on the other hand, while not cheap, at least look reasonable by comparison and could benefit from increased capex.
9. US vs Global Equity Valuations: Another chart that makes US equities look expensive by comparison is when you look at PE10 (or really just about any other valuation metric) for the US vs the rest of global equities. It is true that Emerging Markets and Developed Markets excluding the US have seen a decent rebound in valuations since the March 2020 lows, but there is a clear and compelling relative value case here.
10. Global Equity Super Sectors: The most logical pushback on the previous chart is to note that we could have said something similar for much of the past 5-10 years. So, the question is then what will it take for this gap to close?
One avenue for a turn in relative performance of global vs US is the path of the “super sectors”. A big part of US outperforming the rest of the world has been the high hurdle set by tech and tech related companies. Global ex-US has a big skew to “old cyclicals”. In that respect, the most important technical clues to a rotation in performance between US and global will be the chart below. Specifically look for an upturn in the blue line to get a jump on a ‘virtuous turn’ in US vs global relative performance (and value vs growth for that matter, also smalls vs large – it’s a fairly sprawling issue in equities!).
11. Low Quality Credit – Low Risk Premium: The valuation conundrum is not just the domain of equities – credit also is looking increasingly expensive. The chart that hammers the point home to me is this composite view of where the lower quality credits are trading relative to the higher quality credits. Basically we see a lower and lower risk premium for lower quality credit.
By itself this may not be an issue, particularly if the economic and monetary backdrop are supportive of credit conditions. But if credit conditions deteriorate things could turn sharply here – and indeed, we may well even see early clues of any impending stress in this very indicator itself. So very much one to keep checking in on.
12. China Property Downturn: I always say in my many years of covering China macro, if I could only choose one indicator it would be property prices, and perhaps if I were to pick only one chart it might be the one below.
My composite leading indicator for Chinese property prices (money supply, interest rates, funding) is pointing to an extension of the current downturn deeper and well into 2022. This is of critical importance in so far as the economic pulse and commodity demand is concerned, but also – for the policy outlook: the lower that black line goes, the greater the probability of monetary stimulus (and you know what that means!).
Summary and Key Takeaways:
- The Fed begins 2022 behind the curve on inflation, and is at risk of being pulled into a game of catch up as it tapers and then moves into rate hikes
- The pivot from stimulus to stimulus removal and then tightening poses risks to just about every asset class: particularly in light of the complacency that's taken hold.
- (but) there are upside risks in the form of a possible multi-pronged capex/real investment boom, and eventual albeit stop-start reopening/normalization.
- (but!) there are also some downside risks e.g. a possible growth scare as stimulus gets removed and price pressure bites (can the economy stand on its own two feet now?)
- Another peculiarity about 2022 is that we begin the year with multiple major asset classes looking historically expensive (e.g. US equities, property, bonds)
- With many assets priced for perfection in absolute terms, it leaves relative value as the last bastion, and indeed rotation could well be a key theme this year.
- Following on, dispersion and nuance are also likely to be front of mind as prospects diverge across the globe and across asset classes in what may well be an increasingly divergent recovery...
Overall: Heading into 2022 the risk vs return outlook is clearly and steadily shifting across asset classes, and we’ll need to focus on both short and longer-term indicators to navigate risk as we progress later in this strange but familiar cycle.
Trading in financial instruments and/or cryptocurrencies involves high risks including the risk of losing some, or all, of your investment amount, and may not be suitable for all investors. Prices of cryptocurrencies are extremely volatile and may be affected by external factors such as financial, regulatory or political events. Trading on margin increases the financial risks.
Before deciding to trade in financial instrument or cryptocurrencies you should be fully informed of the risks and costs associated with trading the financial markets, carefully consider your investment objectives, level of experience, and risk appetite, and seek professional advice where needed.
Fusion Media would like to remind you that the data contained in this website is not necessarily real-time nor accurate. The data and prices on the website are not necessarily provided by any market or exchange, but may be provided by market makers, and so prices may not be accurate and may differ from the actual price at any given market, meaning prices are indicative and not appropriate for trading purposes. Fusion Media and any provider of the data contained in this website will not accept liability for any loss or damage as a result of your trading, or your reliance on the information contained within this website.
It is prohibited to use, store, reproduce, display, modify, transmit or distribute the data contained in this website without the explicit prior written permission of Fusion Media and/or the data provider. All intellectual property rights are reserved by the providers and/or the exchange providing the data contained in this website.
Fusion Media may be compensated by the advertisers that appear on the website, based on your interaction with the advertisements or advertisers.