The end of Q1 is rapidly approaching, and what a year this quarter has been! Obviously a lot has changed since the start of the year, and the situation is fluid, to say the least. So I thought it would be helpful to take a quick progress check on the "10 Charts to Watch in 2020 ".
In the original article I shared what I thought would be the 10 most important charts to watch for multi-asset investors in the year ahead (and beyond).
In this article I have updated those 10 charts, and provided some updated comments.
With all that's gone on, some of my initial thoughts and expectations from the original article proved completely wrong – at least at this juncture (still three quarters to go).
So this is quite a good exercise to go through in terms of the "where to from here?" Is it time to double down on some of the original calls? Or, to make a course change?
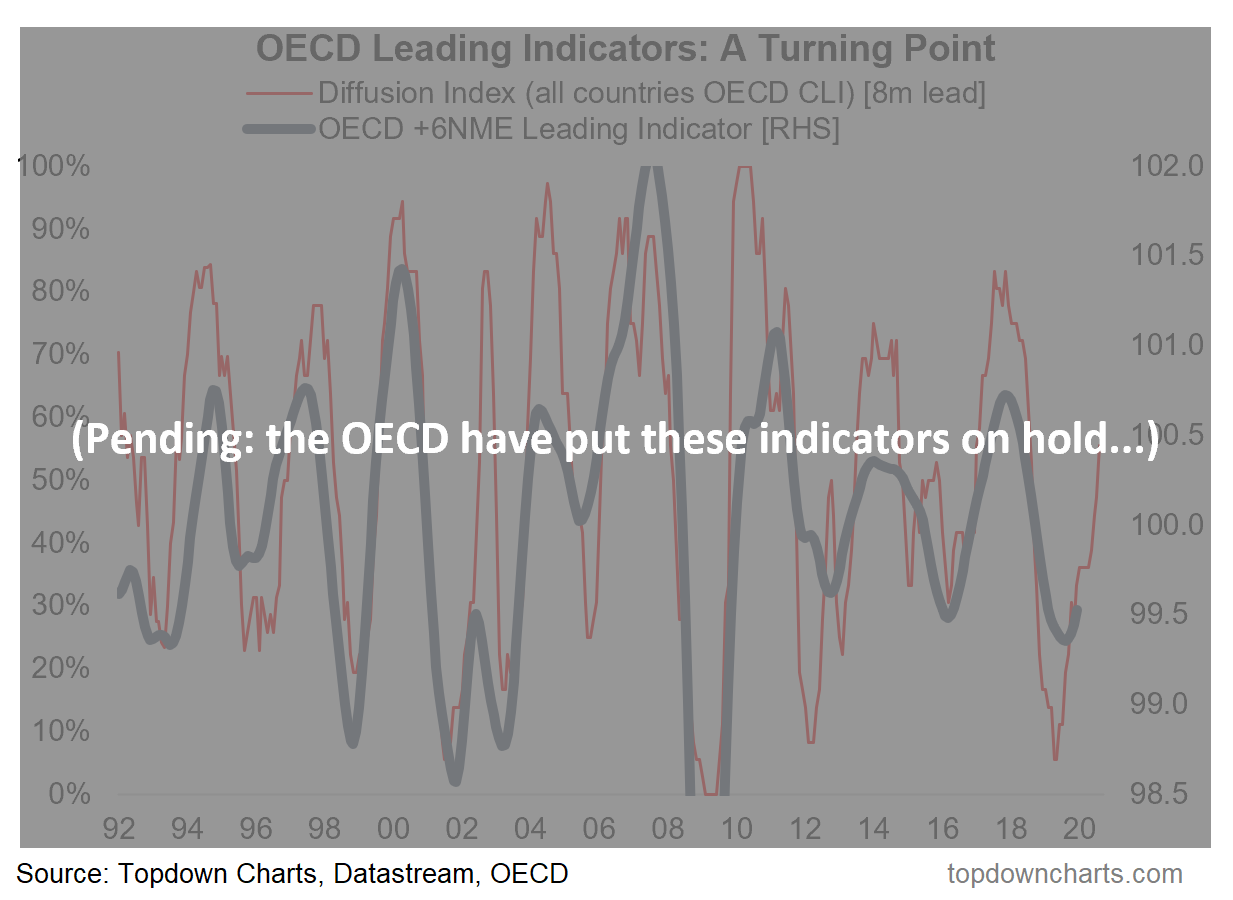
1. Global Economy
First: the OECD has suspended updates to the composite leading indicators (basically the data for the March release did not reflect the pandemic effects yet, so it didn't want to present misleading info). Anyway, it's fair to assume that most cycle/economic indicators will collapse short term (much like what we saw in China). Just about every country has a fiscal and monetary stimulus package implemented to offset this. I would think of this as "economic life support." So the updated view for this one is basically expect nothing much from the economy in the immediate term. The global synchronized rebound idea has been put in self-isolation for now. I do think, however, that on the other side of this the growth rebound will be far greater than anyone expects as a potent combination of base effects, pent up demand, and powerful stimulus takes hold. But that is a topic for later.
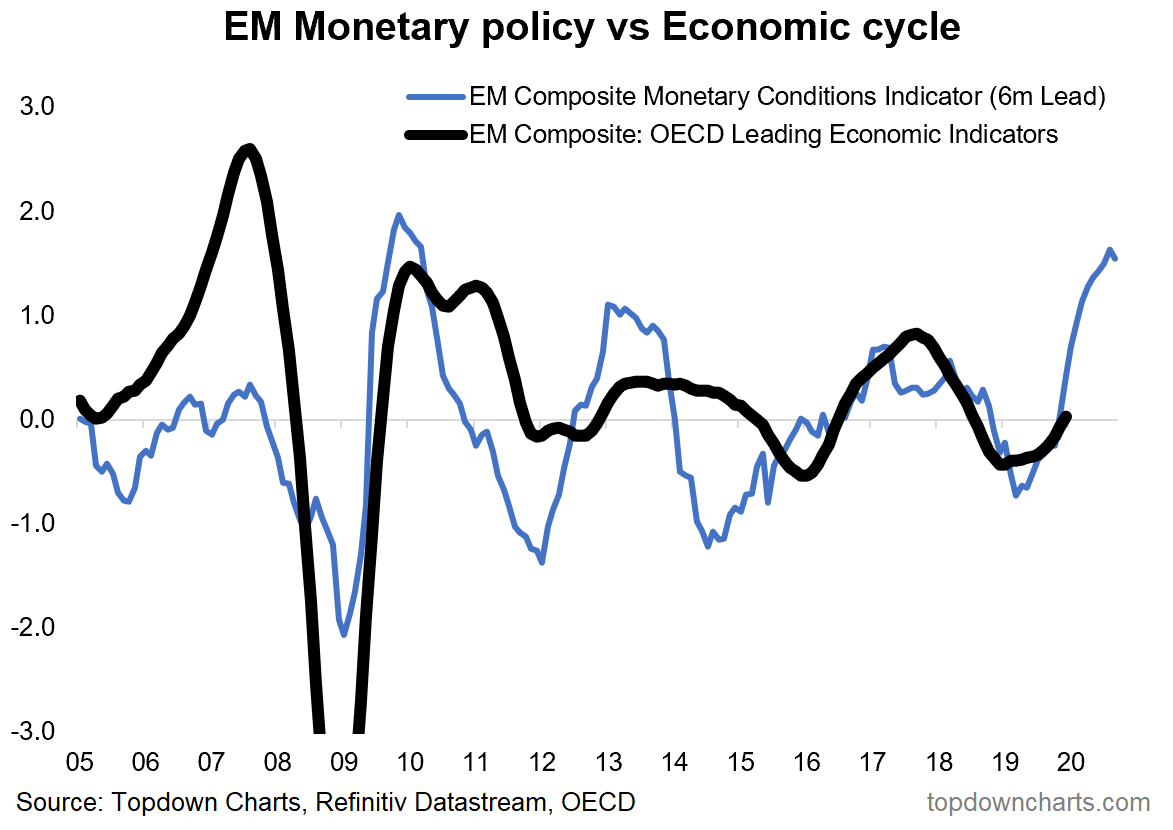
2. Emerging Markets
What's changed for this one is that EM central banks have been busily introducing a further round of monetary easing, but what's also likely to have changed is that initial cyclical upturn is likely to see an abrupt fizzling out. However, what stays the same is that we could still well see EM leading the ultimate rebound as China having taken its medicine already on the virus with its sharp and resolute shutdown, gets back to business. Assuming China manages to stay on top of the virus, I would be closely watching China as an analog for the rest of the world.
3. Growth Assets vs Defensive Assets
In the wake of the corona crash, defensive assets have become more expensive (as investors crowd into safe havens), and growth assets have fallen to really very cheap levels (but more so for global ex-U.S. equities and commodities). I would definitely be doubling down on this one: over the longer run, valuations speak for themselves, particularly at extremes, and now is about as extreme as it gets.
4. TIPS breakevens:
Much like commodities and global ex-U.S. equities, TIPS went from cheap to really cheap. So again, double down on this. But in terms of catalysts, clearly TIPS are tied in with the whole EM equities/commodities/EMFX, etc complex, which are all showing up as cheap (thus attractive from a valuation standpoint), but obviously there will be some water to go under the bridge as EM and commodities face very real near-term headwinds. Sentiment towards these assets has already been resolutely cleaned out, which is a good start, and stimulus measures will help. But stimulus will have to speak louder than the near and pressing shock and awe headlines. We'll definitely get there eventually, as a tipping point is reached.
5. U.S. Equity Valuations
This chart saw quite the change from the start of the year. Back at the start of the year it was a case of absolute valuations look expensive, but relative valuations look cheap. Now, it's a case of absolute valuations don't look that expensive any more, but relative valuations look the cheapest in years. Essentially a reset or winding back of the market clock. In hindsight, it shows the risk of going in/staying in when absolute valuations are lofty.
6. Global Equities
The nascent cyclical bull market in global equities that began last year basically got stricken down by the virus. Obviously we're no longer in a bull market, but would you call it a bear market? Bear markets can happen over the course of years in some cases, and weeks/months in others (like now). Similar to the comment on the previous chart, it's a full reset or winding back of the clock. The market breadth signals now look like they do in the deep dark depths of a bear market or crisis - i.e. like what you see at the start of a secular bull. Of course, the situation is still evolving, so I will leave it at that for now - but will flag the note from last week on the global equities outlook .
7. Commodities
I began the year with optimism on commodities for a few reasons, but a flock of black swans basically shat all over that thesis. It turned out to be a false dawn for commodities, and just as we could say commodities were at a key junction at the start of the year, a couple of key signals and levels stand out to me.
Firstly, we have a line in the sand in the form of the 2008 and 2016 low points (and the 2005 breakout), if that gets broken it likely opens up more downside.
Second, we also have a collapse in breadth to basically oversold levels. Ideally for a medium-term bullish signal there you want to see a collapse, bottom, and turn up in that indicator. So while I can talk about the other things I am watching for this asset class, those are the key high level signposts.
8. FX Volatility
Well, I can say I was right in that volatility came back in violent fashion on direction, the DXY has left a trail of false breakouts in its wake over the past year or so. Given some of the significant bearish medium-term signals for the U.S. dollar, I would expect the sharp surge in the DXY last week will also end up as a false breakout. But with everyone dealing with their own issues and central banks all doing their best to keep their economic patients alive, I would say a good base case is more of the same of ranging and false breakouts in the immediate term.
9. Value vs Growth
'If you liked value stocks before...' So obviously with value stocks slightly over-represented in energy/commodities/financials, and the fact we ended up with the opposite of what I outlined below as macro catalysts for value vs growth (i.e. what we got was lower bond yields, disastrous growth, and lower commodities), this has not worked out so far. Going back to the common theme of this update - valuations - the relative value of value stocks now looks even better. But clearly, we find ourselves tied up with a lot of other common (macro) themes with this one, in terms of catalysts, so it's back to the drawing board for now.
10. China
I had to review the text below before drafting my updated views. Remember the trade war? Anyway, the data to February shows a deepening of the property price slowdown in China, but China A-shares have also taken a bit of a setback as global growth and the domestic economic disruption have stymied this theme. Thus far China has been – in contrast to the rest of the world – a very reluctant easer of monetary policy. They seem very intently focused on not repeating the mistakes of the past of over-easing into the financial crisis in 2009. The risk is they end up making a mistake of under-easing now, and that's something to be wary of here. I think ultimately they get dragged into easing even if domestic activity rebounds as the virus shutdown passes, but rest of world demand fails to show up. So for this one it's also back to the laboratory.
Key Takeaways:
-Expect a delayed rebound in the global economy (which may end up sharper/bigger than initially expected), potentially still led by emerging markets (China in particular).
-Defensive assets are extremely (even more) expensive now, making them possibly sources of risk rather than hedges of risk. And growth assets look very attractive from a valuation standpoint.
-Commodities and inflation expectations have taken a major step back as the macro picture failed to evolve as expected, and while a few things need to go right, they look a lot better now.
-U.S. dollar volatility came back, remain medium term bearish, but expect more false breakouts and vol.
-Double-down bullish global equities. Valuations – a common theme in this update – have moved to very rarely seen levels, and it's entirely possible that a 'generational opportunity' is in the works here.