- Stimulus uncertainty to continue roiling markets in the short-term
- Dollar set to plummet
- Bitcoin keeps hitting new records
American equities on the Dow Jones, S&P 500 and NASDAQ advanced on Thursday for the second day, ahead of the Christmas holiday. The acceleration came as a narrow Brexit deal was finally agreed on between the European Union and the UK. But American investors remained in limbo regarding additional fiscal aid after Congress agreed on a package but in a surprise move US President Donald Trump refused to sign it into law.
Markets will start the upcoming, holiday-shortened week weighing the pros and cons of Trump’s unexpected stimulus shakeup which meant that employment benefits for millions of Americans ended on Saturday and a partial government shutdown could begin on Tuesday if there's no further movement on enacting the bill.
Stocks were lower for the week, as coronavirus continued to escalate, with almost 332,000 deaths across the US and almost 19-million cases reported. Risk-off could continue into the upcoming trading week, notwithstanding the US government's vaccination drive. As of Friday, more than 1 million Americans were inoculated, and it has been the underlying tailwind for stocks and launched the cyclical rotation.
S&P To Accelerate To 5,000?
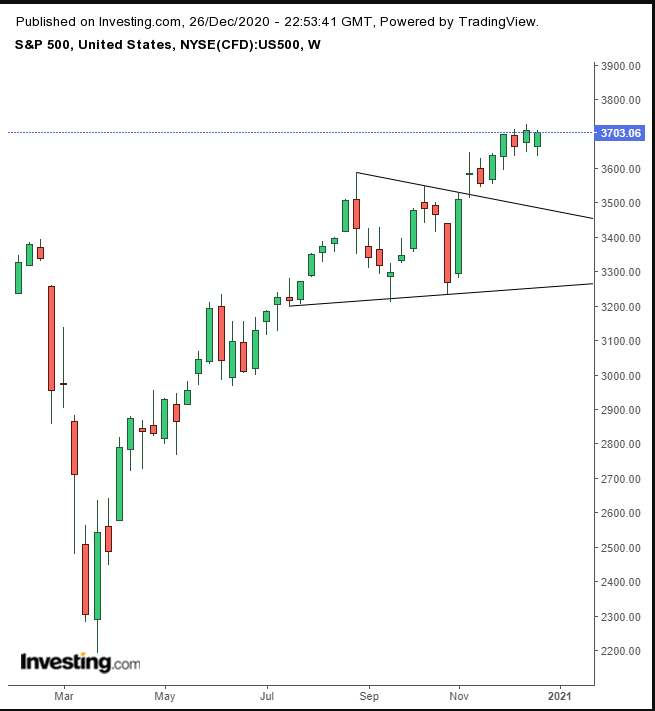
The S&P 500 Index completed a symmetrical triangle within an uptrend, whose implied target points to the 3,900 level. If that's achieved, market forces will have confirmed another, larger pattern.
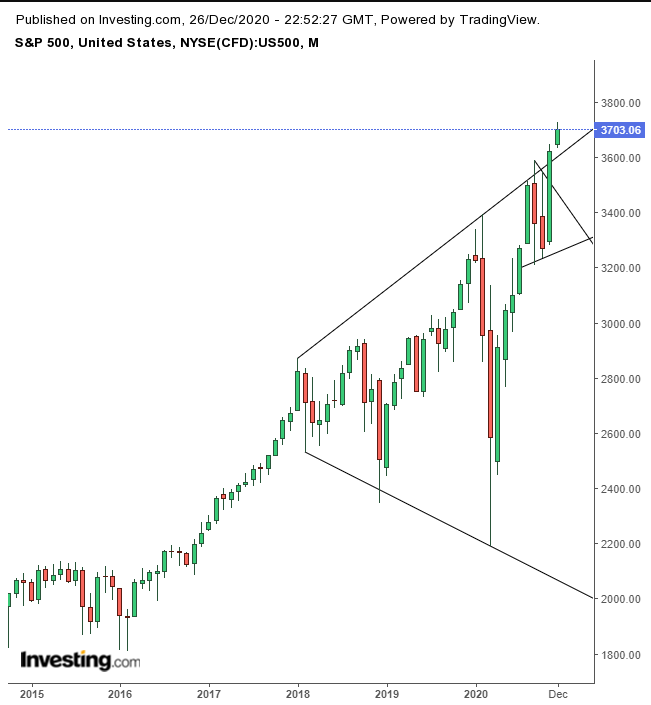
For a long time now, we've been warning of a potential crash, as stocks have been developing a gargantuan broadening pattern since January 2018. However, during December the price broke out of its topside.
A deeper penetration would confirm the blowout of the massive broadening pattern, which would turn it bullish. The implied target indicates it would repeat the dynamics of the broadening pattern to the upside—claiming a target of 5,000. That wouldn't necessarily happen within the next year, but within the next three years, which is the duration of the earlier pattern. Either way, the price is expected to be higher from here, using the current level as a floor.
If this is difficult to comprehend after such a fantastic advance, particularly since the mid-March plunge, consider the following. The past year is said to have been the most disruptive period since World War II. That conflict ushered in a golden age for the US economy which lasted for decades.
Of course, global conditions are not the same as they were then: post-WWII the US had the upper hand in the wake of global devastation in Europe and Asia, and now China’s economy is set to overtake the US by 2028 according to the Centre for Economics and Business Research after the Asian nation weathered the pandemic better than the West.
The dollar paused on Thursday as investors considered what might happen next in the US stimulus saga. From a technical standpoint, however, it’s the quiet before the storm.
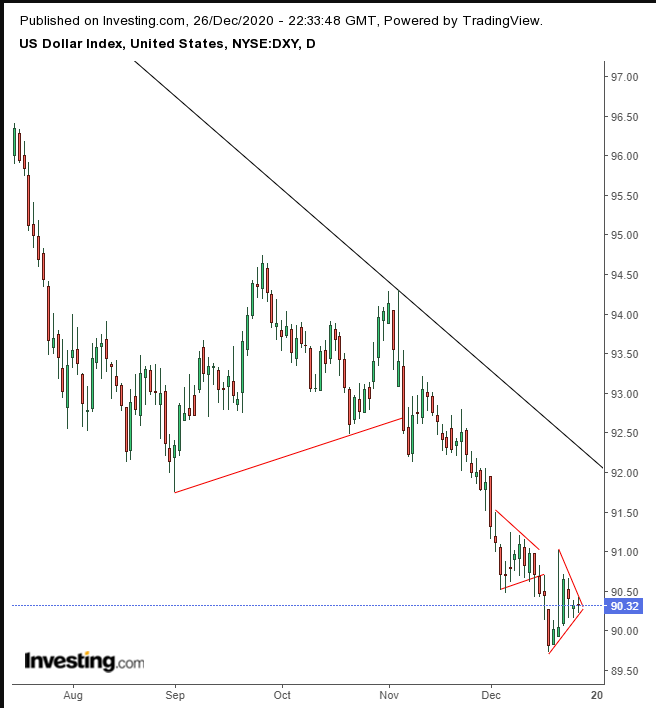
The greenback has been trading within a second consecutive continuation pattern, whose downside breakout would signal a resumption of the downtrend since the March peak. After the $900 billion COVID aid package was agreed to by a bipartisan group of lawmakers, dollar traders had little reaction. We understood that to mean the stimulus was already priced in.
However, after Trump characterized the individual allocations of $600 per person in the current package as a “disgrace,” additional stimulus is no longer a foregone conclusion. This may push the dollar lower still. However, should Trump get his way, pushing through an even bigger package—he's said he wants the personal allocation to be raised to $2000—the dollar is likely to plunge.
A dollar drop would provide gold with the fundamental tailwind to complete a bullish flag.
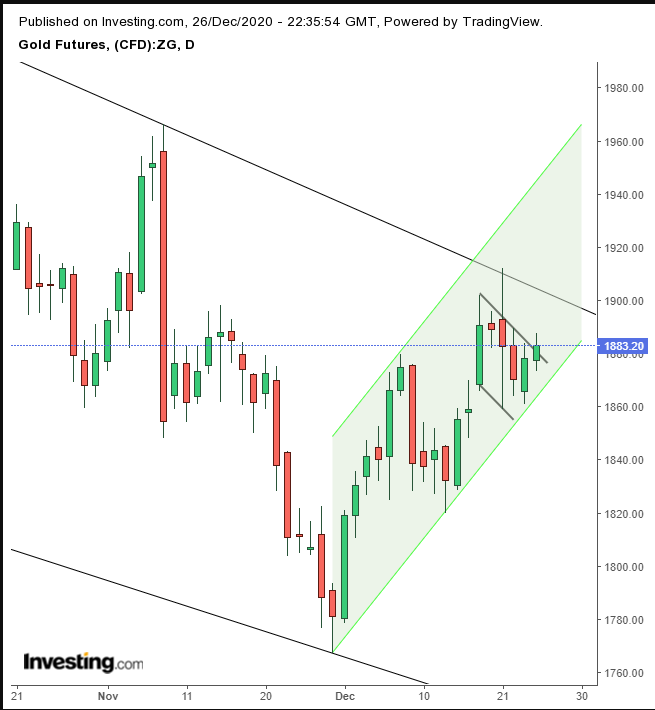
Should this occur, the precious metal would break free of its falling channel since its August peak. It was a banner year gold, which hit its first new all-time high since 2011 in August, breaking past the $2000 level. The yellow metal is up about 21%, though it had gained 36% by the time it hit its new all-time high.
Bitcoin, one of this year’s most amazing stories has been surging to new records through this weekend, currently trading at $27,685 at time of writing. That's an increase of 297.4% since the start of the year, making it likely the cryptocurrency will hit 300% as it accelerates before the year is out. Demand continues to persist as institutions and respectable market commentators pull a “mea culpa” on ever doubting value of the digital token.
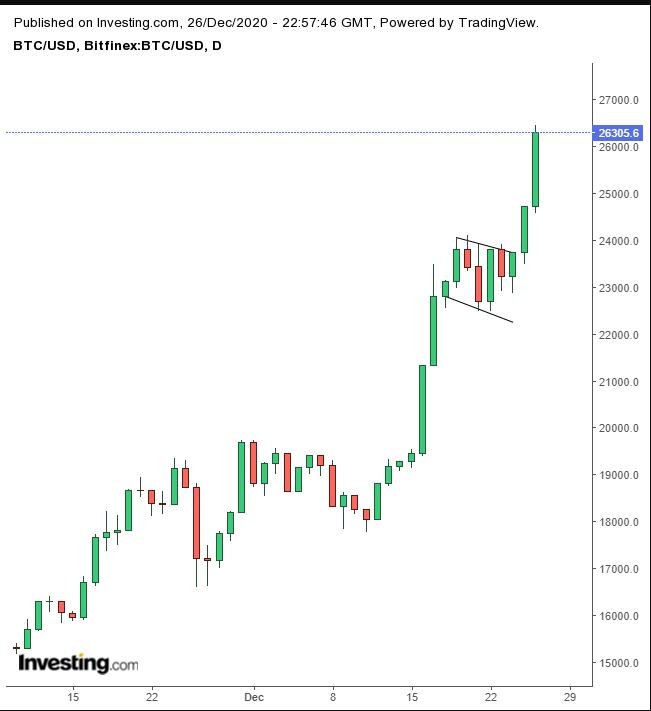
Bitcoin completed a bearish flag and provided a decisive bullish breakout, on its way to our $28,400 target.
Oil climbed on Friday for a second day.
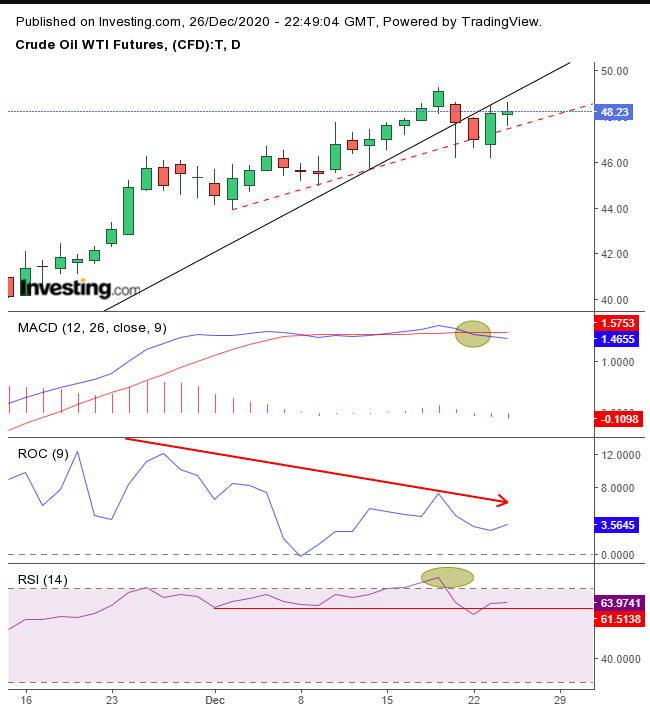
But its high-wave candle demonstrated a lack of direction, finding resistance by the broken uptrend line from the Nov. 2 low. The MACD’s short MA has already fallen below its long MA. While the RSI struggled to maintain momentum after falling from a 75-overbought condition, the ROC gave an outright negative divergence.
Some 2020 Hindsight
No one could have predicted what a crazy year 2020 would be. It was a year with one big lowlight but also a few highlights, all of which we think are worth noting. At the forefront: the more than 80,355,000 global cases of coronavirus as we write this and the almost 1,758,000 fatalities worldwide.
In the span of one year the pandemic fueled the worst economic contraction since the Great Recession in the 1930s, following the 1929 market crash. This year, in contrast, though the stock market fell into the fastest bear market in history during March—with the S&P 500 diving 34% from all-time highs in just 23 days—it then exited this bear market in record time, with the market catapulting to new highs in August. It took just four months, compared with the historical average of a little over four years.
Nevertheless, investors who hung on tightly enjoyed some of the best returns in equity market history. Technology stocks shocked investors: after losing 30% from the February record to the March bottom, the NASDAQ100 is up almost 82%—in just 9 months.
Some tech equity standouts this year:
Tesla (NASDAQ:TSLA) has done the unimaginable. Elon Musk's electric vehicle company has created a clean, green energy car, and rather than becoming a niche stock, shares exploded. Currently the company’s market cap of more than $627 billion tops the valuation of the world's nine largest automakers —Volkswagen (OTC:VWAGY), Toyota (NYSE:TM), Nissan (OTC:NSANY), Hyundai (OTC:HYMLY), General Motors (NYSE:GM), Ford (NYSE:F), Honda (NYSE:HMC), Fiat Chrysler (NYSE:FCAU) and Peugeot (OTC:PUGOY)— combined!
As of Dec. 21 when it was added to the SPX, Tesla is the single largest company in the prestigious index.
Though it's just a website without any real assets, Airbnb (NASDAQ:ABNB), a platform where homeowners can rent space to travelers or vacationers went public on Dec. 10, with a valuation over $100 billion—making it worth more than hotel giants Marriott (NASDAQ:MAR) and Hilton (NYSE:HLT) combined. It took a lot of courage for the owners to go public during a global pandemic, but their timing was auspicious: just ahead of the vaccine rollout, which has been boosting stocks which suffered with social distancing in effect, especially travel-related companies.
Even if travel remains restricted into the coming year, since there are likely will be lockdowns in the early months of 2021, now that more people are working from home, why not do it from someone else's home for a change, booked via Airbnb, of course.
Oil Market Breaks...Briefly
The lockdowns, which began in March kept cars parked and planes grounded, also triggered something that's never happened before and which many imagined would never be possible. Oil contracts fell below $0. On April 20 the price of the commodity dropped to -$40.
But then, crazily, oil bounced back the very next day as it headed back to over $10 a barrel and hit $40 in June. That means that in a span of two months oil crashed $40 below zero and bounced to +$40.
With So Many Risks, Why Are Investors Still All-In?
As mentioned above, markets rebounded from the edge of disaster as if nothing had happened. And we didn't even mention ongoing worries such as the current US president refusing to acknowledge that he lost the November election. One of the great headwinds should be that Trump's behavior may not allow for a peaceful transition of powers on Jan. 20, when President-elect Joe Biden is inaugurated.
Yet despite the uncertainty, investors have been able to look past this and increase risk. With so many questions still clouding the view of the future, why have investors remained willing to pay the highest prices in history for some equities?
The answer: governments don’t want markets to fall. As such, they're doing everything in their power to keep fueling them higher. Never in history have fiscal and monetary policies been so accommodative. During the last Fed meeting in mid-December, the US central bank promised to keep pumping cheap money into the economy while leaving rates near 0% till the country reaches full employment again. In other words, the stimulus will be open-ended.
Along with the governments fiscal aid, the Fed keeps buying US bonds for additional quantitative easing. The Federal Reserve's balance sheet ballooned from $4.41 trillion, which includes all the stimulus since the 2008 crash, to $7.24 trillion by Nov. 10. Put another way, the Fed pumped almost as much money into the US economy in a few months as it pumped in 11 years.
If investors can borrow cash for next to nothing and flip it into quick profits, why shouldn't they? It's the key reason investors are willing to take a leap of faith and invest their money, even during the worst pandemic in 100 years.
Some Predictions for 2021
While Warren Buffet, CEO of Berkshire Hathaway (NYSE:BRKa), (NYSE:BRKb), says he doesn’t know what to make of the current market, his long-time friend and vice chairman Charlie Munger expects the market rally will slow significantly, if not crash.
Though we were bearish during much of the exuberance seen earlier this year, now, however, we're putting our judgement aside—see our call for the S&P 500, above—though we're still concerned. As we mentioned earlier, and as 2020 has shown us, a great economic drop can be the prelude for an equally great economic recovery.
Sectors To Keep An Eye On
If the vaccinations prove effective and the domestic and global economy begin to normalize, those sectors that suffered the most throughout the lockdowns should see some significant gains: Energy, travel-related stocks, Real Estate, Financials and Utilities will be in the best position for the biggest gains, after investors dumped them in favor of technology shares.
Those sectors are now the cheapest, since investors sold them off in order to buy the hot pandemic stocks. As well, those sectors also stand to grow the most, since they'll be in demand as economies come back from the dead.
The Week Ahead
All times listed are EST
Tuesday
10:00: US – CB Consumer Confidence: expected to rise to 97.0 from 96.1.
Wednesday
10:00: US – Pending Home Sales: seen to jump to 0.2% from -1.1%.
20:00: China – Manufacturing PMI: likely edged up to 52.2 from 52.1.
Thursday
8:30: US – Initial Jobless Claims: anticipated to have jumped to 835K from 803K the previous week.
Friday
Global markets closed for the New Year holiday.
