TSMC Q2 profit soars 61% to record high; sees AI demand offsetting forex headwinds
- 80% of companies already reported beat earnings estimates
- Defensive sector, Utilities, outperformed
- 10-year yield still in uptrend with yield curve close to flattest for this economic cycle
- VIX higher this year than all of 2017
- Signals pointing to bear market?
After numerous massive earnings beats were reported over the course of the past week, have investors regained their bravado? Are markets out of the red? Neither is very likely.
Though the NASDAQ and S&P 500 eked out narrow gains to close (barely) higher on Friday, we believe volatility is far from over. As such, chances are very good we'll be seeing additional selloffs ahead. Here are 5 reasons why:
1. Despite about 80 percent of companies that have already reported beating estimates—handily—with average growth rates of close to 20 percent in Q1, the S&P 500 is in the red for the week, albeit by just 0.01 percent.Though some of the growth could be attributed to tax cuts, nevertheless the fundamentals have been strong.
Indeed, marquee names such as Facebook (NASDAQ:FB) and Amazon (NASDAQ:AMZN) crushed it on earnings last week, which should have sent the benchmark index higher. So why have investors not been able to shake free of everything else weighing on sentiment, including geopolitics and fears that US economic growth has peaked?
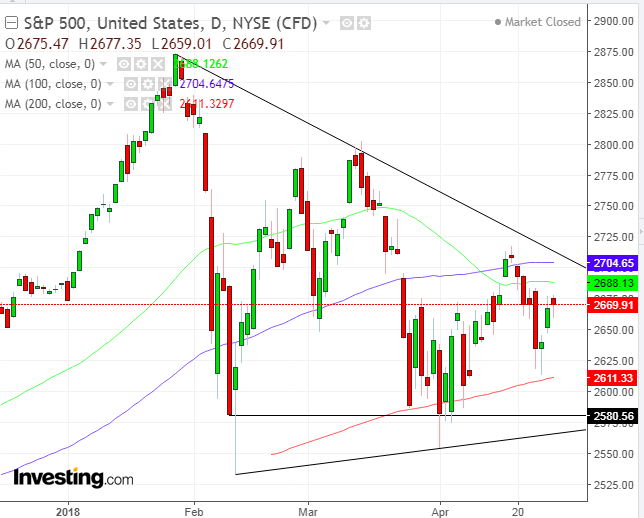
Technically the S&P 500 remains within what may be a bearish Descending Triangle and the rally on Friday—on top of failing to produce a weekly advance—is still suppressed below the 50 DMA (green) after it crossed below the 100 DMA (blue), a bearish sign in itself, as well as below the downtrend line which is also the triangle top.
Though strong earnings have been the lifeline investors were counting on to rescue them from the outlook for higher rates and trade-related tariffs, and though so far they've gotten what they wished for and then some, stocks are still flat for the year. When bullish developments fail to support prices, it generally means that they're about to plummet.
2. The sector that outperformed on a weekly basis was Utilities, up 2.80 percent. These are shares investors generally buy as a defensive gesture...when they have little to no expectation of economic growth. Even on Friday, when stocks advanced, Utilities gained just 1.02 percent, second only to Real Estate, which moved higher by +1.34 percent.
The main drivers for equity rallies, Technology and Financials, were both in the red for the week, -0.48 percent and -0.65 percent respectively. Technology was down 0.48 percent even as FAANG stocks saved the week from being worse. On Friday alone, even when stocks advanced, the tech sector dropped 0.18 percent.
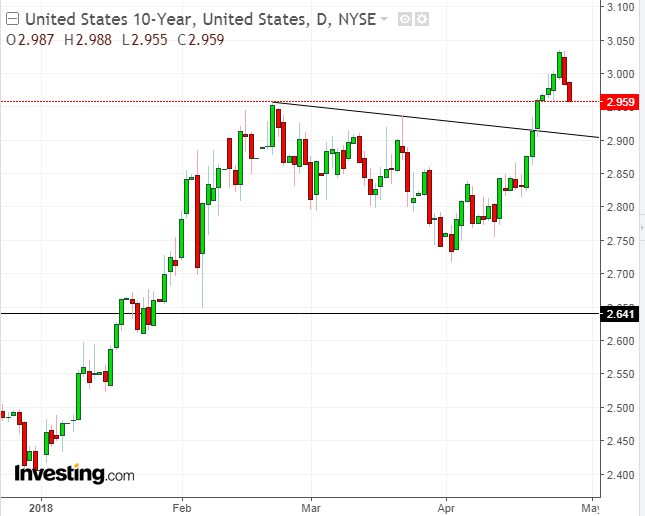
3. From a technical perspective, the 10-year yield, the catalyst for the initial market selloff in late January, is retreating in the course of a natural correction. Nevertheless, yields are still well within an uptrend.
But why did the yield suddenly surge? Because commodity prices rallied. WTI jumped to $68 a barrel, a three-and-a-half year high. Investors were concerned that rising prices would spur inflation higher.
On Tuesday, just hours after 10-year Treasury yields hit 3 percent for the first time in four years, Caterpillar (NYSE:CAT) issued warnings that current earnings have reached their 'high water mark,' triggering a market selloff. Although 10-year yields have been climbing to highs not seen in four years, so have 2-year yields, maintaining a 48 basis points gap, meaning the yield curve is close to the flattest its been in this economic cycle.
This increases the probability for an inverted yield, in which long-term bonds pay a higher yield than short-term bonds. It's what many investors consider a significant signal, the lead-in to an economic downturn.
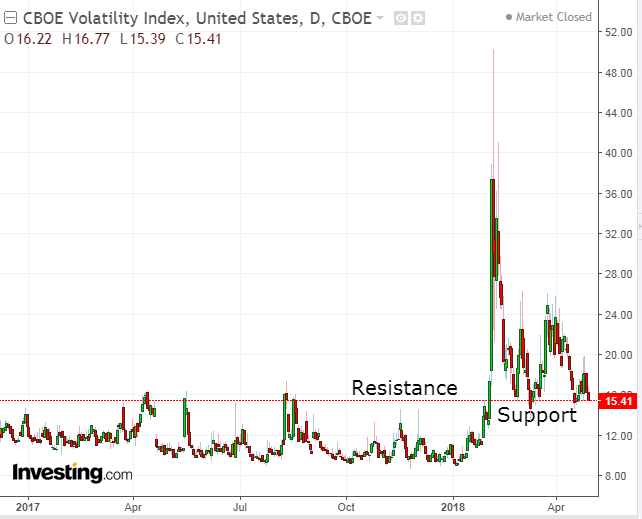
4. Even following the second half of last week's equity rallies, volatility is above almost all of the highs seen in 2017 and above all of this year's lows. Investors buy the CBOE Volaitility Index as a bet on future volatility, which then eventually subsides. Yet the 15.00 level, this year's low so far, is the highest point for almost all of last year, and it's now acting as a support.
Bear On The Horizon?
If the best earnings in years has left stocks flat, while all the negative worries remain, positive corporate fundamentals in the coming weeks may not be enough to buoy equities. In addition, the technical outlook is negative.
A decisive downside breakout of the 2,580 level of the S&P 500 would complete a triangle top, as well as cross below the 200 DMA (red). A trough lower than the February 12, 2,532.69 low would formally establish a downtrend and afford a real chance at a much deeper correction.
It is accepted that 20 percent declines signal a bear market. After the near-12-percent slide in late January, all that would be required to call this an official bear market is an additional 8 percent drop. The triangle pattern's implied target is more than enough to reach that objective.
Key Economic Events
All times listed are EDT
Sunday
21:00: China – Manufacturing and Non-Manufacturing PMIs (April): the official manufacturing PMI reading is expected to fall to 51.3 from 51.5, while the services sector survey remains flat at 54.6.
Monday
8:00: Germany – CPI (April, preliminary): forecast to remain steady at 1.6% YoY.
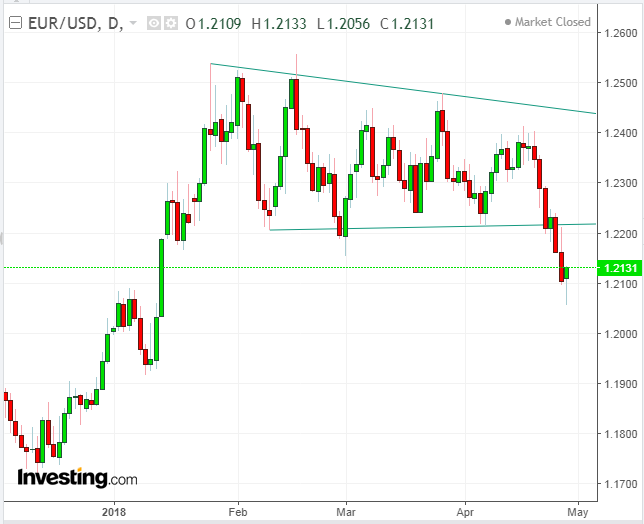
Last week's press conference following the ECB meeting and rate decision featured central bank president Mario Draghi appearing confident on growth. However, he didn't seem ready to pull the plug on QE. Trader reaction after Draghi spoke helped complete a bearish Descending Triangle for the euro, a mirror image of the dollar's Ascending Triangle.
8:30: US – Personal income (March): expected to grow 0.4% from 0.2% MoM, while Personal Spending is expected to rise 0.4% from 0.2% MoM.
9:45: US – Chicago PMI (April): forecast to rise to 58.2 from 57.4.
10:00: US – Pending Home Sales (March): expected to fall 3.4% YoY from a 4.1% drop in February.
Tuesday
00:30: Australia – RBA Decision: expected to remain at 1.5 percent.
4:30: UK – Manufacturing PMI (April): expected to fall to 54.9 from 55.1.
10:00: US – ISM Manufacturing PMI (April): expected to fall to 58.6 from 59.3.
21:45: China – Caixin Manufacturing PMI (April): expected to rise to 51.6 from 51.
Wednesday
1:00: Japan – Consumer Confidence (April): forecast to rise to 44.6 from 44.3. Governor Kuroda pushed back in last week's BoJ meeting, against speculation that the BoJ would back away from fixing the 10-year yield at zero percent, adding that the policy will remain in effect for the foreseeable future, weighing on the yen.
4:30: UK – Construction PMI (April): forecast to rise to 50.9 from 47.
5:00: Eurozone – Unemployment Rate (March), GDP Growth (Q1, flash): unemployment forecast to remain at 8.5%. QoQ GDP to slow down to 0.4% falling from 0.6%, and 2.5% YoY, from 2.7%.
8:15: US – ADP Employment Report (April): expected to see 194K jobs created from 241K a month earlier.
10:30: US – EIA Crude Inventories (w/e 27 April): stockpiles forecast to rise by 130,000 to 2.170M of barrels.
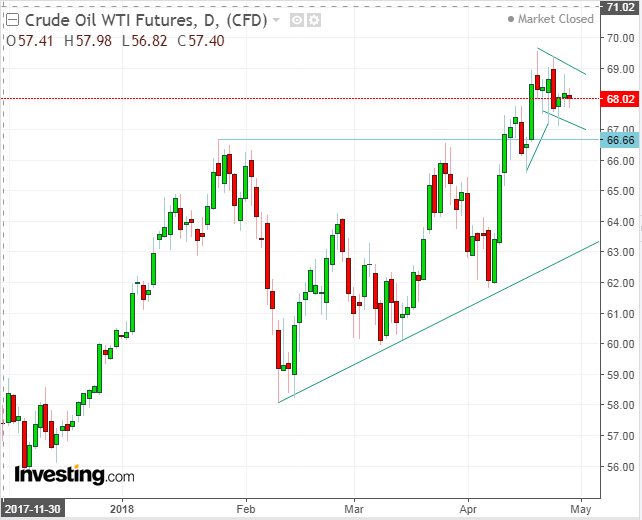
The price of oil has climbed $11.49, or 19.8 percent, from its February 9th low of $58.07, to the April 19 high of $69.56 in just 11 weeks. After reaching a 3.5 year high, its natural that investors would wish to take profits on the commodity, resulting in a correction.
Technically, this is part of a return move, after completing a bullish Ascending Triangle, within another, small bullish continuation pattern, the Falling Flag. An upside breakout above $69 would strongly suggest that the key $70 level could be breached as well.
14:00: US – FOMC Statement: having raised rates at the last meeting, the Fed is now expected to leave rates at 1.75%. With no press conference afterward, the focus will be on the committee’s report and the ‘dot plot’ showing members' rate forecasts.
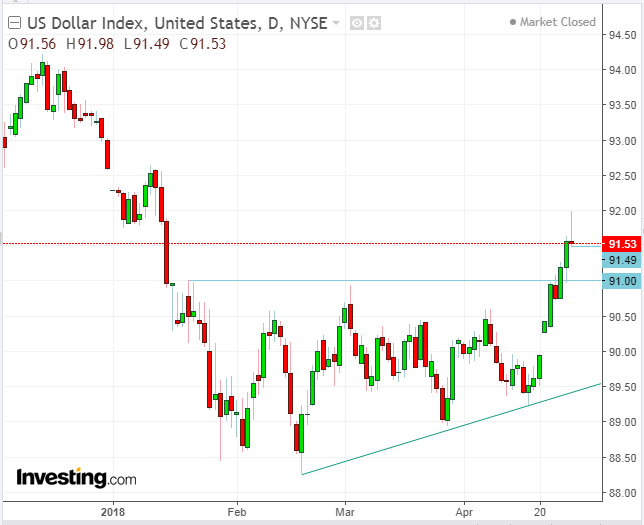
The Dollar Index retreated from 92.00 this past week, forming an extremely bearish shooting star, with an extremely long upper shadow and a very small real body. However, having completed a bullish ascending triangle, which is a potential bottom, the bearish implication of the candle should be considered as a sign for a correction, with the 91.00 triangle top acting as support.
Thursday
4:30: UK – Services PMI (April): expected to rise to 53,3 from 51.7.
5:00: Eurozone – CPI (April, flash): YoY figure to remain flat at 1.3% and 0.9% from 1.0% YoY for Core CPI.
8:30: US – Trade Balance (March), Weekly Jobless Claims (w/e 28 April): expected to see deficit increase to $61.1 billion from $57.6 billion; initial claims expected to rise to 216K from 209 last week.
10:00: US – ISM Non-Manufacturing PMI (April): expected to fall to 58.1 from 58.8.
21:45: China – Caixin Services PMI (April): private survey of non-manufacturing sector to rise to 52.4 from 52.3.
Friday
8:30: US – Nonfarm Payrolls (April): 185K jobs expected to have been created from 103K a month earlier, while average hourly earnings are forecast to rise 0.2% MoM from 0.3%. The Unemployment Rate could fall further, to 4.0% from 4.1%.
10:00: Canada – Ivey PMI (April, seasonally-adjusted): forecast to rise to 60.2 from 59.8.
Which stock should you buy in your very next trade?
With valuations skyrocketing in 2024, many investors are uneasy putting more money into stocks. Unsure where to invest next? Get access to our proven portfolios and discover high-potential opportunities.
In 2024 alone, ProPicks AI identified 2 stocks that surged over 150%, 4 additional stocks that leaped over 30%, and 3 more that climbed over 25%. That's an impressive track record.
With portfolios tailored for Dow stocks, S&P stocks, Tech stocks, and Mid Cap stocks, you can explore various wealth-building strategies.

