Trump says he will sue Wall Street Journal, NewsCorp, over Epstein letter report
U.S. equity markets have hit another rough patch. The S&P 500 and NASDAQ Composite each finished the past week down for a third consecutive week while the Dow was off for a fifth straight week.
Most market watchers are pointing to continuing U.S.-China trade tensions as the primary culprit. But a popular market technical gauge has been telling a different story.
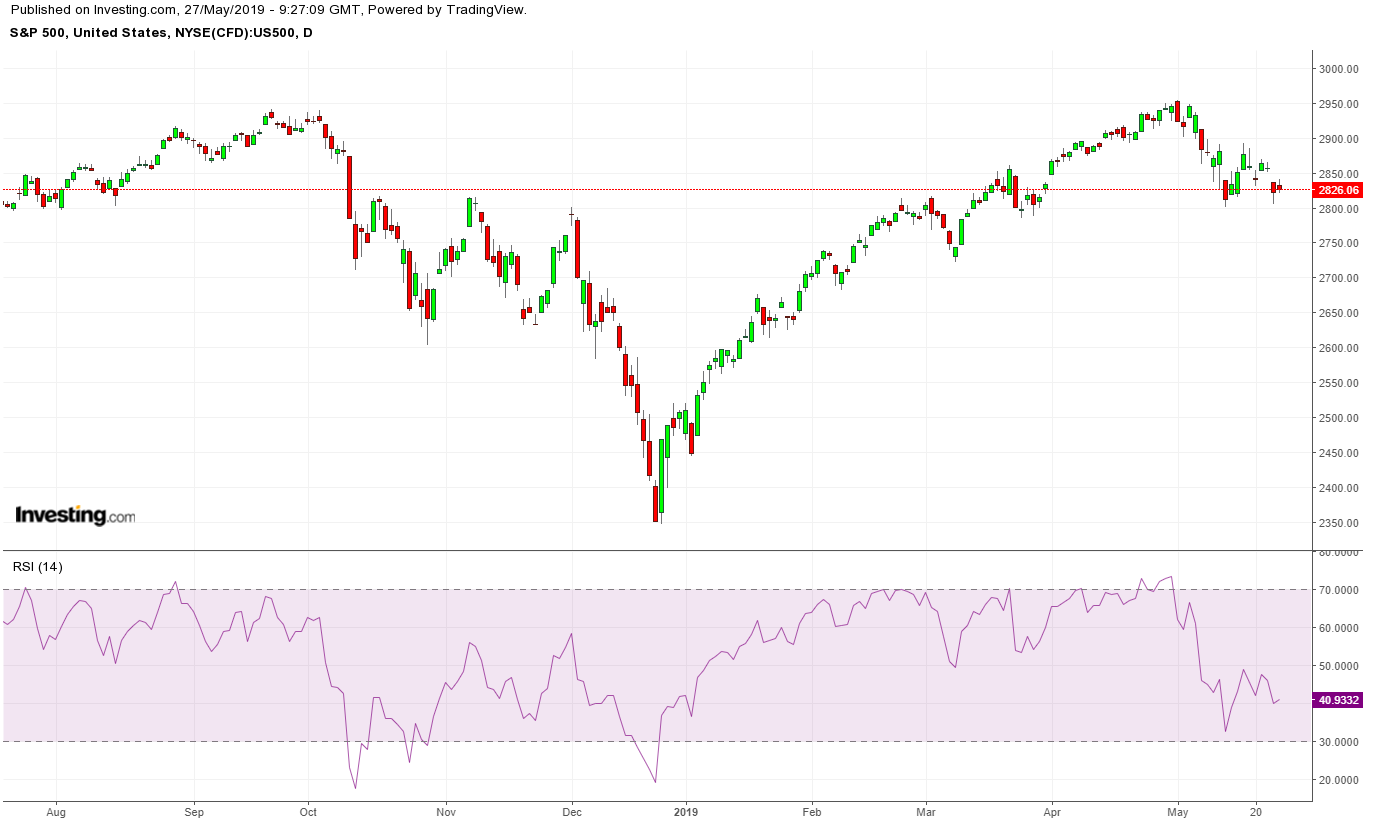
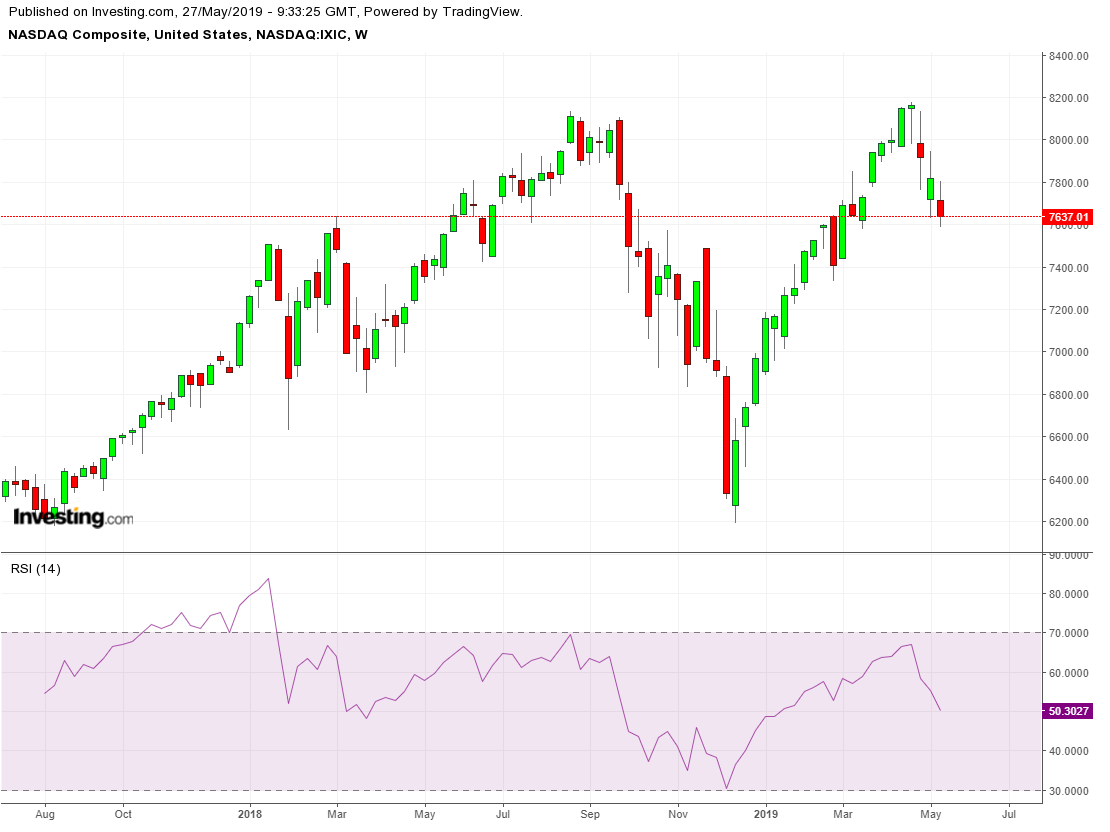
A key market indicator, the relative strength index (RSI), signaled in late April that the big, post-Christmas rally had become overbought and was vulnerable to a sell-off. And indeed, just as the RSI—which signals both the strength and potential direction of market or individual asset momentum—indicated, stocks have been struggling since. As well, Friday's close suggested a big rebound is not yet at hand.
The uptrend after Christmas was terrifically friendly, but investors should always keep a close watch on whether the trend might be about to turn. Truly savvy investors know a friendly trend will bite you sooner or later. Which is why familiarity with the RSI might just be a trend watcher's best friend.

The RSI for the S&P 500 hit 73.5 on April 30.

The NASDAQ's RSI had topped 76 the day before.
For those unfamiliar with RSI specifics, a reading above 70 is a warning. A reading above 75 suggests a top is at hand. Above 80 is a serious sell signal.
Likewise, when an RSI drops below 30, it's a sign a bottom is near. It also indicates a rally is forming.
In fact, the RSI values for the S&P 500 and NASDAQ (and the Dow) approached 30 by May 13, as heavy selling hit U.S. stocks. However, they did not move decisively lower.
As of Friday's close, the RSIs for all three indices were stuck in the 40s. Each has been unable to move higher, stuck approximately 40% or more below their highs at the end of April. Additionally each may drift until there's a real catalyst such as a genuine U.S.-China trade deal.
RSI and other, similar, technical indicators are crucial components of today's computerized trading strategies. There are so many inputs into the algorithms that control automated buying and selling that people's minds simply can't process all that information quickly enough. Using RSI values for automated trading thus triggers buy and sell decisions. That's why an index can rise or fall multiple percentage points seemingly instantaneously.
What's occurred since the end of April has happened repeatedly in the past few years as computers run more and more trading. In December, The Wall Street Journal suggested that 85% of trading at the end of last year was done via computerized algorithms and passive investing strategies that just followed the market.
It's also made markets mirror each other more closely. After President Donald Trump's 2016 election, stocks in the United States, Japan, Brazil and India all rose 40% into last week.
Still, though RSI is a good indicator, it's not perfect. It will tell you that a top or a bottom is coming, but it won't say when.
The ugly selloff in the fall of 2018 was a dramatic demonstration of this reality. It started innocuously enough. The market had rallied through the summer, despite President Trump's criticisms of the Federal Reserve, inflation jitters and other fundamental headwinds.
But in late August and September, the NASDAQ, S&P 500 and Dow all started to flash overbought signals through their RSIs. Stocks started to drift. In mid-October, the drift became a slump which morphed into a global near-panic right before Christmas.
The Dow dropped nearly 12% in the fourth quarter. The S&P 500 fell 14%, as did Germany's DAX. The NASDAQ plunged 17%; so did Japan's Nikkei Index.
The Christmas Eve sell-off was the worst U.S. stock market performance ever on a Christmas Eve. But by then, the RSIs for the Dow, S&P 500 and the NASDAQ were already flashing buy signals. The S&P 500's RSI hit 19 on Dec. 24, a level not seen even during the 2008 financial crisis.
You can't ask for a more serious buy signal. And sure enough, the rally took off on Dec. 26.
Which stock should you buy in your very next trade?
AI computing powers are changing the stock market. Investing.com's ProPicks AI includes 6 winning stock portfolios chosen by our advanced AI. In 2024 alone, ProPicks AI identified 2 stocks that surged over 150%, 4 additional stocks that leaped over 30%, and 3 more that climbed over 25%. Which stock will be the next to soar?
Unlock ProPicks AI

