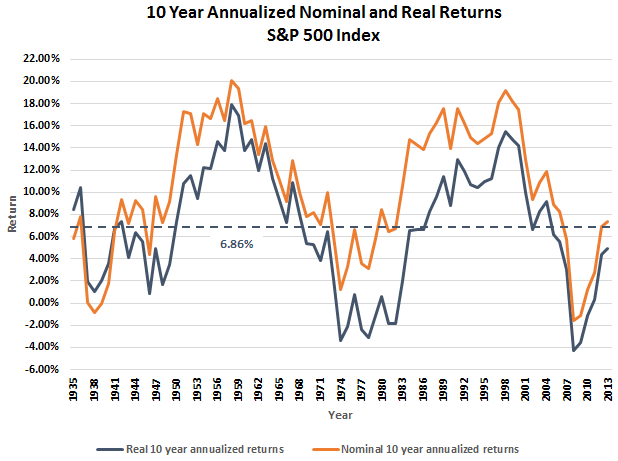
I wrote a post a few days ago that highlighted the 10-year annualized returns for the U.S stock market and the MSCI World Index. The summary of the article and the chart was the 10-year annualized market returns remain below their long term averages. A number of our articles are published on SeekingAlpha as was the one just mentioned. One comment to the SeekingAlpha article raised the question that the real returns may display a different result. In short, though, the real versus nominal returns, on a ten-year time frame, were not vastly different as can be seen in the below chart.

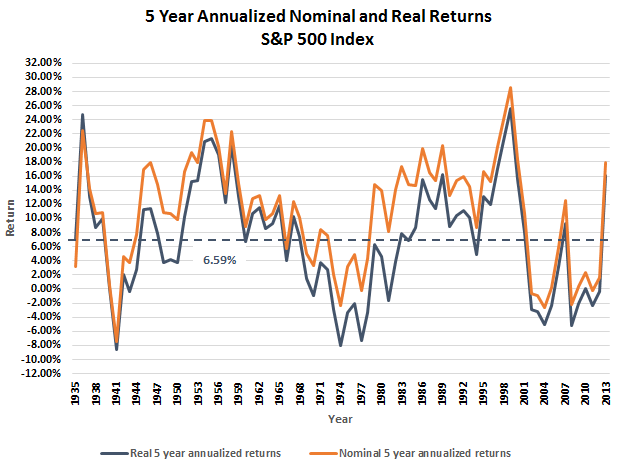
I believe a part of what has investors concerned about the current market at this time is the strength of the market's recovery since the depth of the financial crisis in 2008 and 2009. Additionally, the recent market advance has occurred nearly on an uninterrupted basis, i.e., without a significant correction. The strength of the recent market move is evident in the below chart that looks at the 5-year annualized return for the S&P 500 Index going back to 1926. On this shorter time frame, the rolling 5-year annualized return is far above the average of all the five-year returns.

Which stock should you buy in your very next trade?
AI computing powers are changing the stock market. Investing.com's ProPicks AI includes 6 winning stock portfolios chosen by our advanced AI. In 2024 alone, ProPicks AI identified 2 stocks that surged over 150%, 4 additional stocks that leaped over 30%, and 3 more that climbed over 25%. Which stock will be the next to soar?
Unlock ProPicks AI