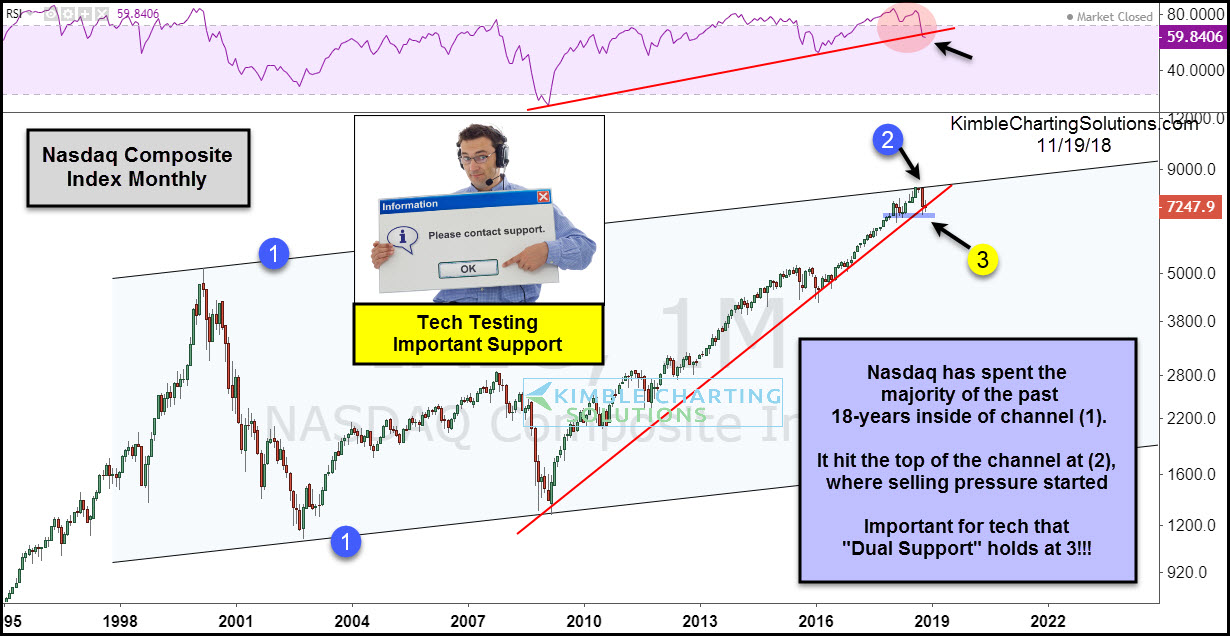
This chart looks at the Nasdaq Composite index over the past 22 years on a monthly basis. The chart shows that the index has spent a majority of the past 18 years inside of rising channel (1).
The rally off the 2009 lows hit the top of the channel a couple of months ago at (2), where it looks to have created a bearish hanging man pattern as it kissed the underside of the rising channel. It hit resistance as momentum is at the highest level since the dot-com highs in 2000.
Selling pressure over the past 6 weeks has this important tech index testing 9-year rising support this month as momentum looks to be moving lower after creating lower highs.
The long-term trend for the index remains up as it faces one of its most important support tests in the past 9 years at (3). If dual support does not hold at (3), look for selling pressure to ramp up.
Which stock should you buy in your very next trade?
AI computing powers are changing the stock market. Investing.com's ProPicks AI includes 6 winning stock portfolios chosen by our advanced AI. In 2024 alone, ProPicks AI identified 2 stocks that surged over 150%, 4 additional stocks that leaped over 30%, and 3 more that climbed over 25%. Which stock will be the next to soar?
Unlock ProPicks AI