With the monthly brouhaha of nonfarm payrolls now consigned to history, and as we start a new trading month, it’s time to revisit the dollar index chart, starting with the slower time frames to help provide some guidance for the US dollar from a technical perspective. The chart here is the USDX, which is based on an equally weighted basket of four currencies, the euro, the yen, the British pound and the Aussie dollar, with a 25% weighting of each currency. This provides a more balanced view given the heavy euro weighting in the DXY index.
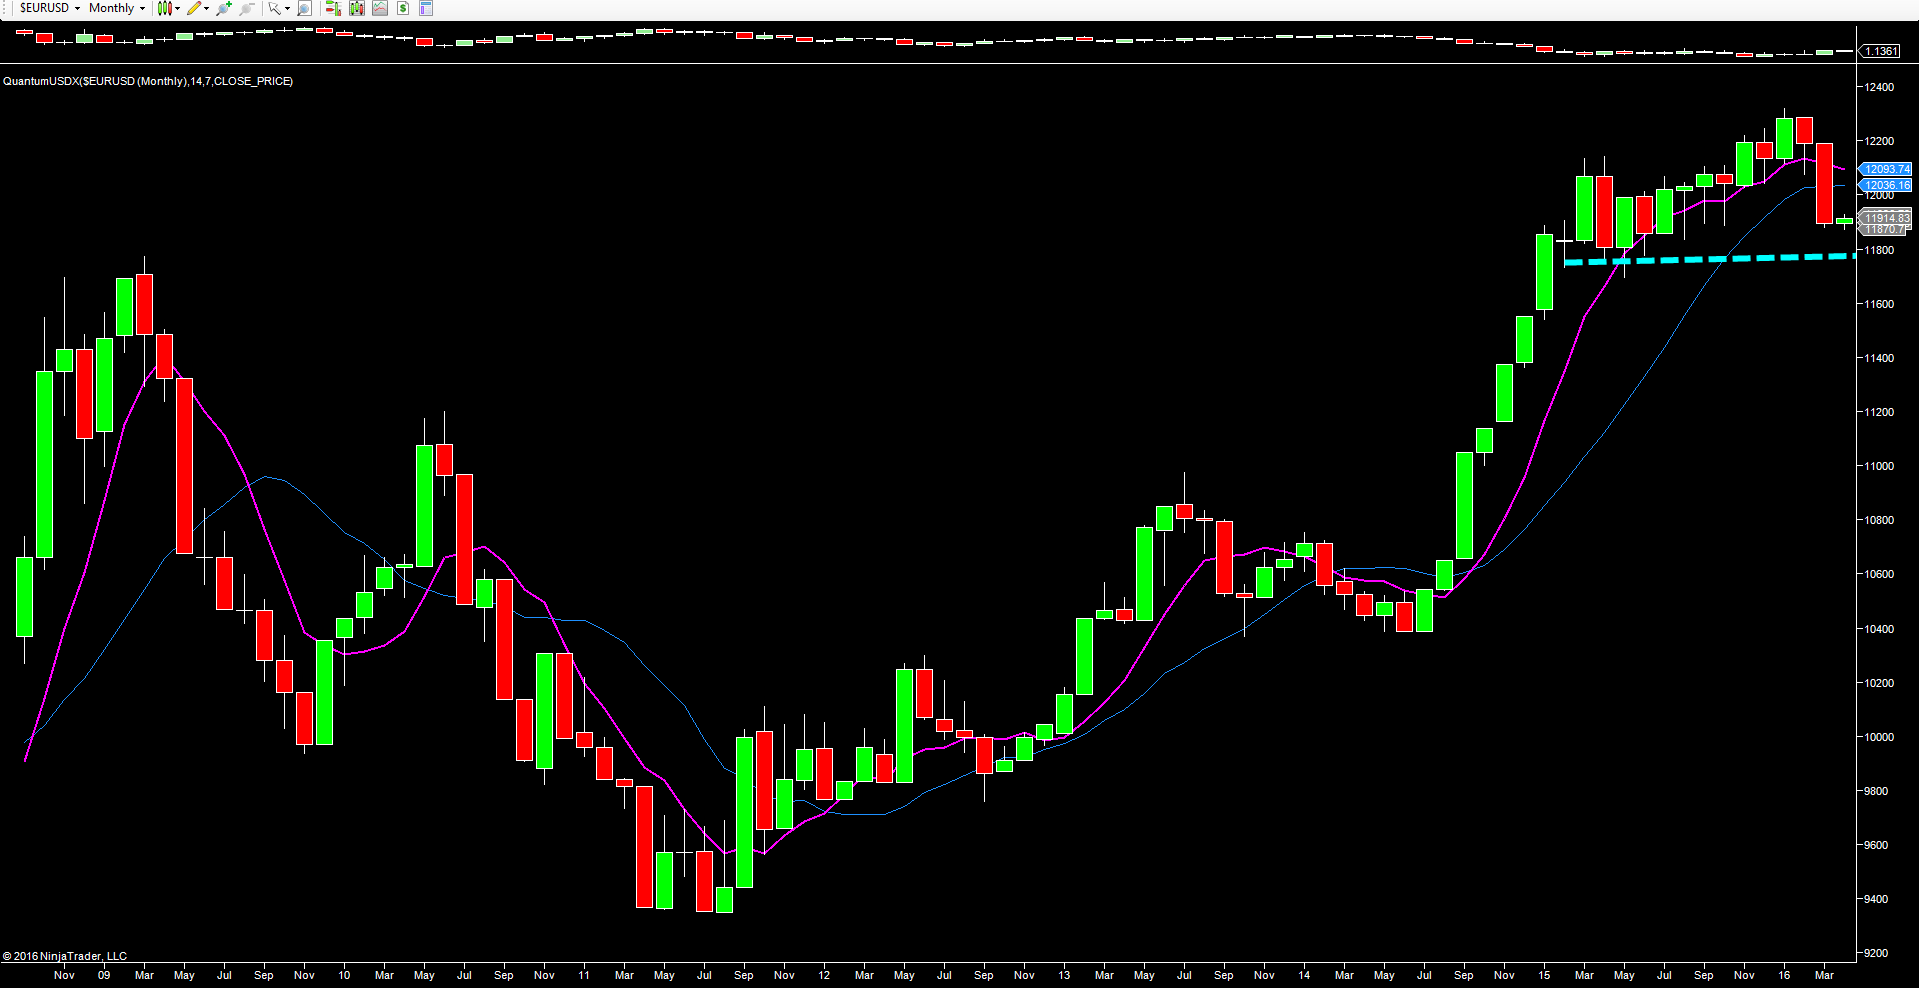
If we start with the monthly chart, the widespread down candle of March reinforced the change in sentiment for the dollar, reflecting the more dovish tone from Fed members over the last few weeks, and closing well below the psychological 12,000 level, ending the month at 11,894. From a technical perspective, the well-developed support region now awaits in the 11,7940 region, which may well define the longer-term trend for the US dollar should this level fail to hold. A break though may well herald the beginning of a trend reversal and the instigation of a longer bearish trend.

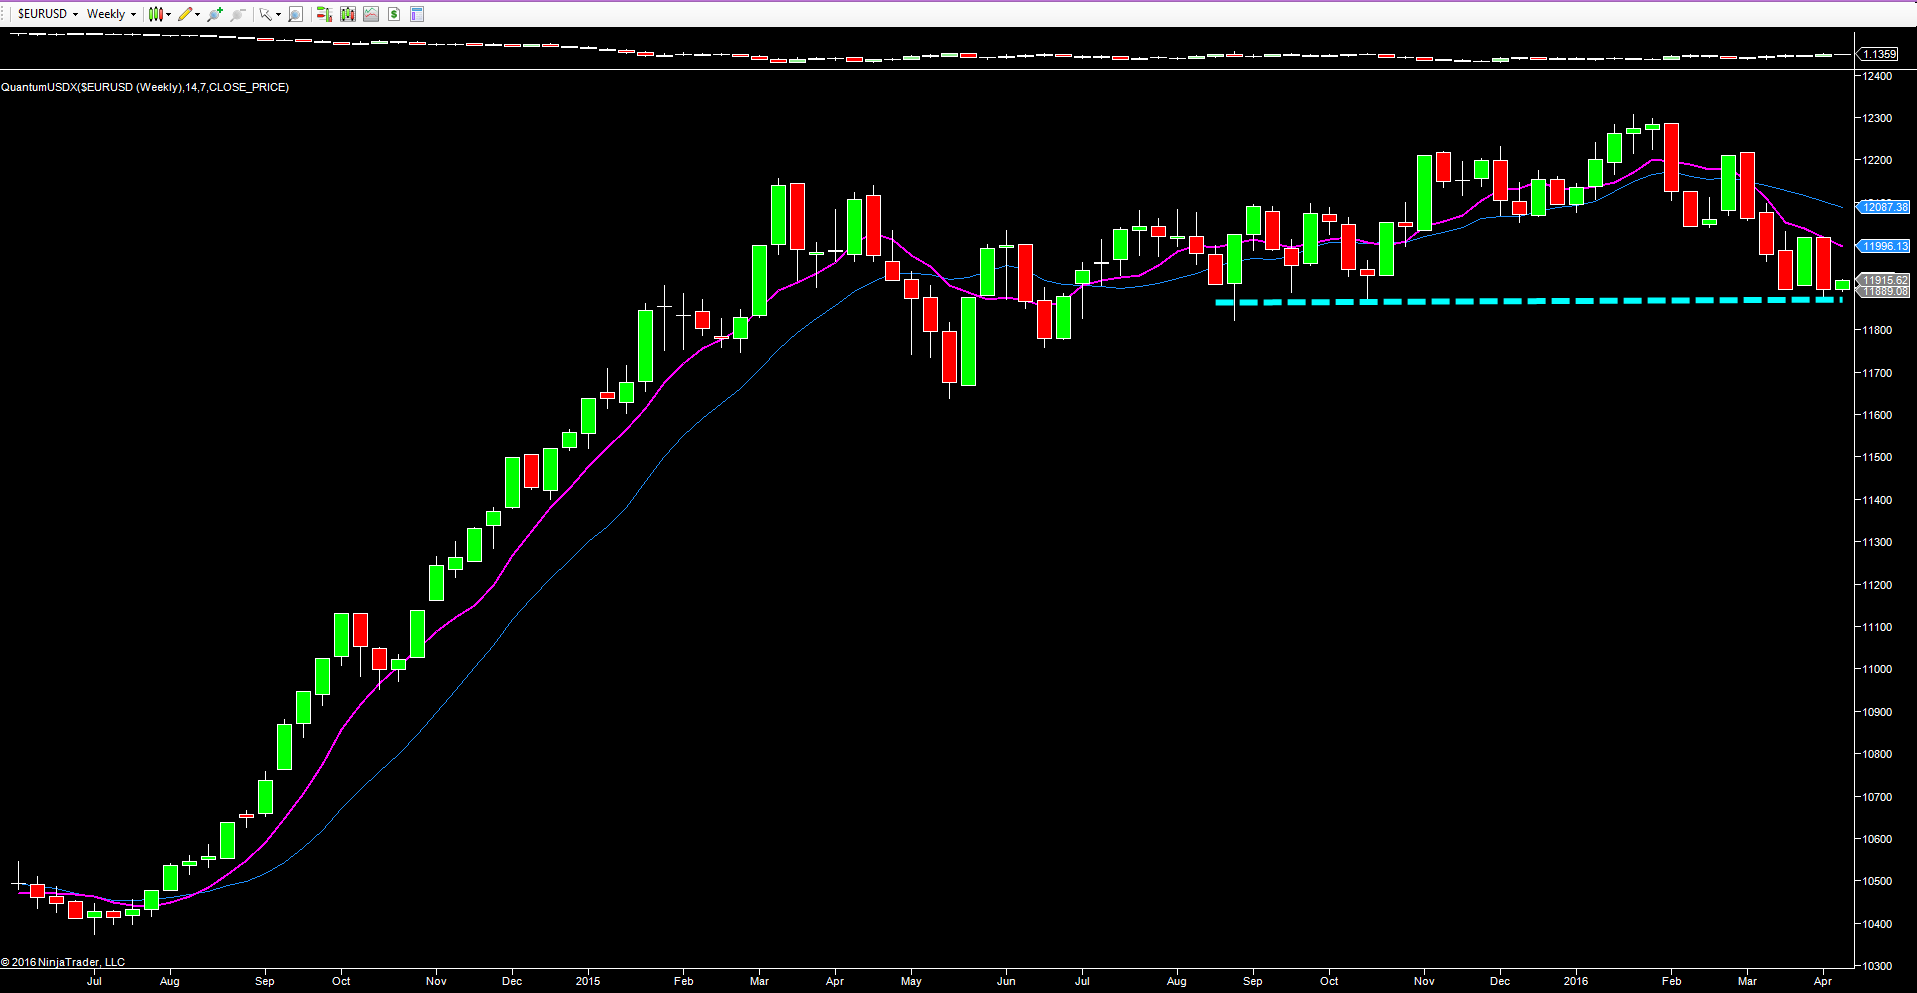
Moving to the weekly chart, this too reflects the change in sentiment since early February, with the index now testing support in the 11,840 area, as denoted by the blue dotted line. This was the level which held back in October, which saw the index duly climb to test the 12,300, but any failure in this region will then see the index move lower to test minor support in the 11,670 region. If this fails to hold, the trap door may open for the US dollar, with further long-term weakness building.
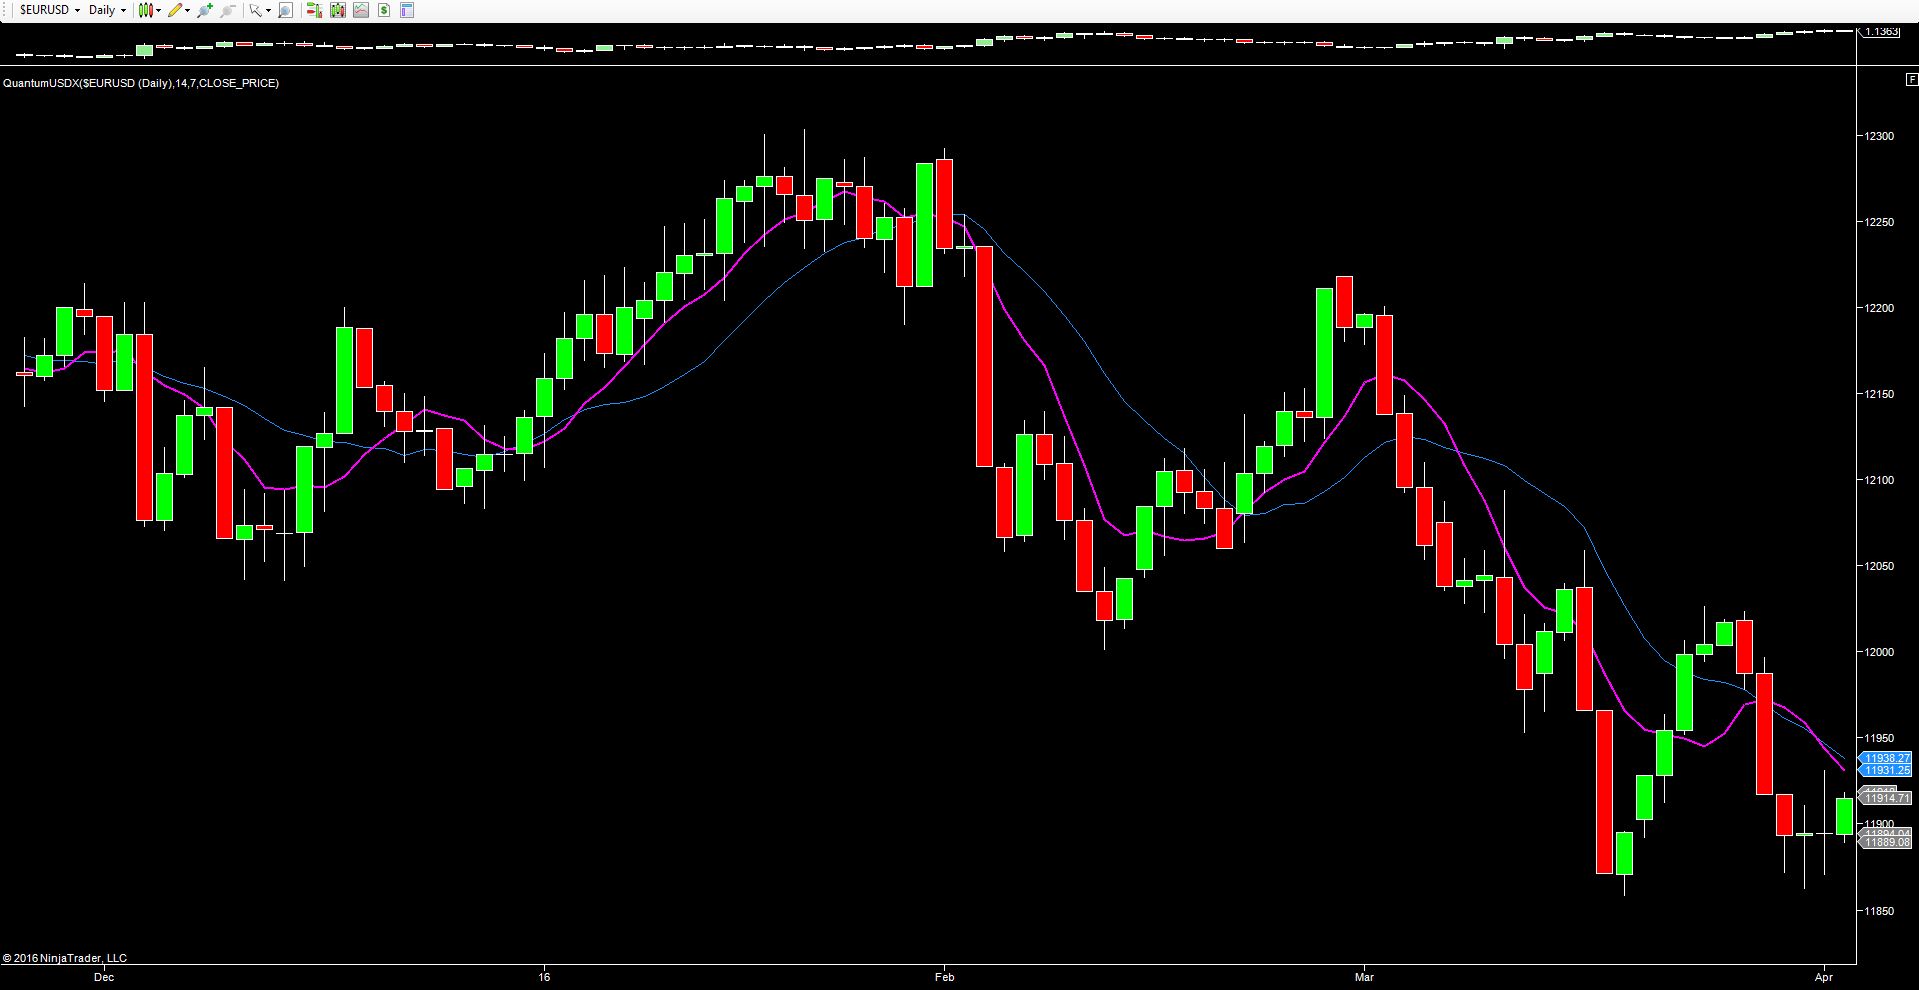
And finally to the daily chart, with Friday’s long-legged doji candle clearly signalling the indecision of the market following Friday’s Nonfarm Payrolls, which delivered a marginally better than expected number for the headline jobs created, but with an increase in unemployment to 5%. A mixed bag duly reflected in Friday’s price action across the markets, with the index finding some minor support in the 11,860 area and currently trading higher at 11,914.01 as it attempts to recover some of last week’s lost ground. With little in the way of fundamental news to drive the index today, we could see a relatively muted day of price action for the US dollar.
Which stock should you buy in your very next trade?
With valuations skyrocketing in 2024, many investors are uneasy putting more money into stocks. Unsure where to invest next? Get access to our proven portfolios and discover high-potential opportunities.
In 2024 alone, ProPicks AI identified 2 stocks that surged over 150%, 4 additional stocks that leaped over 30%, and 3 more that climbed over 25%. That's an impressive track record.
With portfolios tailored for Dow stocks, S&P stocks, Tech stocks, and Mid Cap stocks, you can explore various wealth-building strategies.

