Trading recommendations
Sell Stop 2164.0. Stop-Loss 2175.0. Objectives 2138.0, 2123.0, 2110.0, 2102.0
Buy Stop 2175.0. Stop-Loss 2164.0. Objectives: 2183.0, 2186.0, 2192.0
Overview and Dynamics
After a sharp fall immediately after the announcement of the first results of the election of a new US president on Wednesday, November 9, the US stock market is changing direction. Equity assets have suffered the most severe losses in a few months immediately after the announcement of the election results, but then at the beginning of the trading session in Europe rebounded half.
Yesterday, the second day in a row on the market are actively buying shares of large US banks and industrial companies, resulting in the Dow Jones Industrial Average closed at a record high near the mark 18808. Dow Jones Industrial Average index rose yesterday by 1.2%, surpassing the previous record level of closing 18636, which was reached on August 15. Overall, this week, the index rose by more than 5%.
Other major US stock indexes have behaved differently. Nasdaq Composite, for example, reduced the second consecutive day. On Thursday, it fell by 0.8%, as shares in the technology sector fell. S&P 500 this week increased by 4% to reach 2183.0 in the area of annual maxima located near the level of 2192.0. Today, the S&P 500 grows slightly in the early European session, trading near the mark 2170.0. Yesterday the yield on 10-year US Treasury rose to 2.113% from 2.070% level recorded on Wednesday, surpassing for the first nine months of 2% mark.
Trump calls for a reduction in taxes, restrict immigration and intends to pursue protectionist policies in trade. Investors in the United States calculated that during the presidency of Donald Trump will put additional fiscal stimulus and increased interest rates.
Economists expect the Fed to raise rates twice in the next year. The US economy is steadily showing signs of recovery. One of rising interest rates is not sufficient for breaking the bullish trend of the US market. The markets are likely to stabilize in the run-up to the December meeting of the Fed. Despite the fact that recent data NFPR were lower than forecast (in October, the number of jobs has increased by 161 000 at the forecast 173 000 and 191 000 in September, and the unemployment rate, as expected, declined to 4.9% from 5, 0% in September), still, it is quite strong performance, along with data on US gross domestic product, to the Fed could raise rates in December.
After the elections carried out when the markets finally calm down, to the fore once again perform US macroeconomic indicators. And they show a very positive trend. And it will be a strong supporting factor for the dollar and for the American stock market.
Technical Analysis
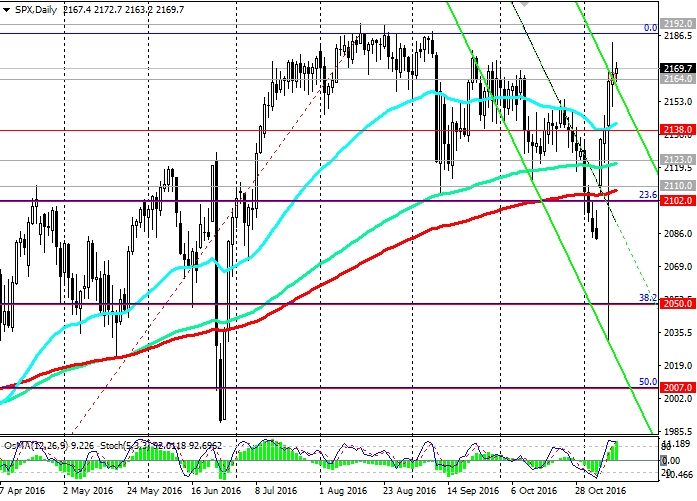
With the opening of today's S&P 500 index rose again, but only slightly in comparison with the the strongest growth in the last two days that took place against the background of the victory of Donald Trump in the presidential race in the United States. The S&P 500 has already blocked the fall of the previous month and once again rushed to the area yearly highs near the mark 2192.0. After a strong volatility environment, when they were announced the results of presidential elections in the United States, the index rising for the fifth consecutive day. The volatility index was 9 November nearly 140 points, or 6.8%, and the price of the S&P 500 at the end of the trading day the medium was fixed at the level of 2162.0.
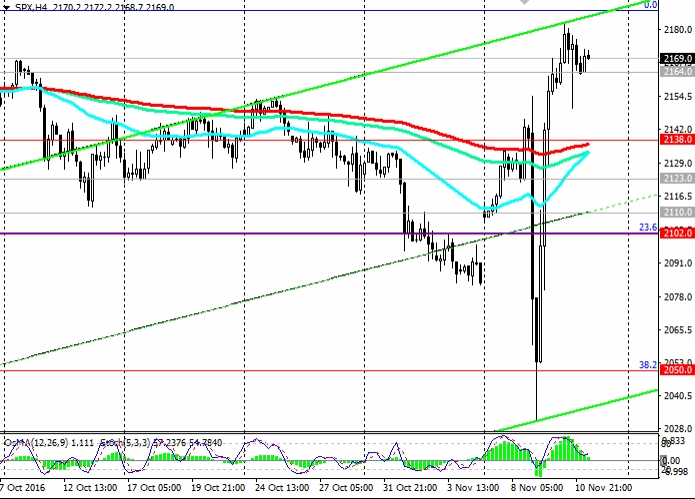
Indicators OsMA and Stochastic on the daily, weekly, monthly charts again went over to the buyers. However, on the 4-hour chart indicators signal the possible short-term downward correction. Today there is possible profit-taking and closing of long positions in the S&P 500 , which will cause its natural decline at the end of the trading week. In this case, the reduction in the form of a correction is possible to the support level of 2138.0 (EMA200 on 4-hour chart).
However, while the S&P 500 index is above the levels of support 2110.0 (EMA200 on the daily chart), 2102.0 (23.6% Fibonacci level of the correction to the growth since February 2016 and the level of 1828.0), the positive dynamics of the index maintained. Long positions remain a priority, even if the dollar strengthens on the foreign exchange market.
In the reverse scenario, the reduction in the event of the breakdown of the support level targets will be the levels 2138.0 2123.0 (EMA144 on the daily chart), 2110.0, 2102.0. Breakdown level of 2102.0 could trigger a further decline to the support level of 2050.0 (38.2% Fibonacci level, EMA200 on the weekly chart) under the newly formed downtrend channel on the daily chart. But a breakdown of the support level of 2007.0 (50.0% Fibonacci level) can talk about the end of the bullish trend.
Support levels: 2138.0, 2123.0, 2110.0, 2102.0, 2070.0, 2050.0, 2030.0, 2007.0
Resistance levels: 2183.0, 2192.0
Which stock should you buy in your very next trade?
AI computing powers are changing the stock market. Investing.com's ProPicks AI includes 6 winning stock portfolios chosen by our advanced AI. In 2024 alone, ProPicks AI identified 2 stocks that surged over 150%, 4 additional stocks that leaped over 30%, and 3 more that climbed over 25%. Which stock will be the next to soar?
Unlock ProPicks AI

