Trump announces 50% tariff on copper, effective August 1

The U.S. stock market indexes were mixed between -0.5% and +0.3% on Friday, as investors took some short-term profits off the table following the recent advance. The S&P 500 index has reached the new record high of 2,940.91. The Dow Jones Industrial Average gained 0.3% and the technology Nasdaq Composite lost 0.5% on Friday.
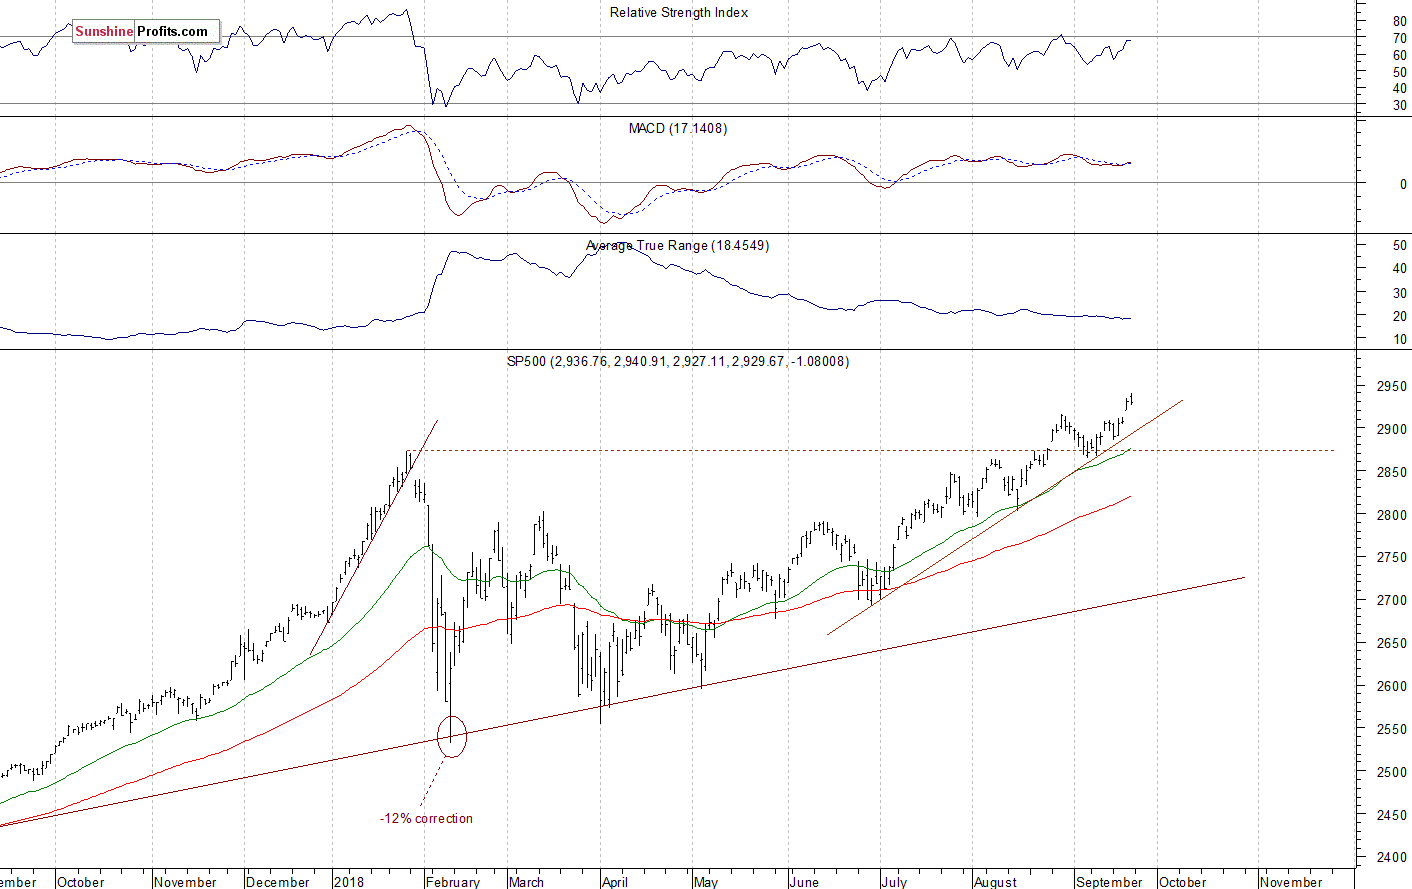
The nearest important level of support of the S&P 500 index remains at 2,915-2,920, marked by Thursday's daily gap up of 2,912.36-2,919.73. The next support level is at 2,900. The support level is also at 2,885-2,890, marked by the recent local lows. On the other hand, the level of resistance is at around 2,940-2,950.
The broad stock market reached the new record high on Friday, as the S&P 500 index extended its short-term uptrend above the level of 2,900. Will it continue higher despite some short-term technical overbought conditions? There have been no confirmed negative signals so far. The index continues to trade above its three-month-long upward trend line, as we can see on the daily chart:
Downward Reversal or Just Correction?
The index futures contracts trade 0.2-0.4% below their Friday's closing prices. So expectations before the opening of today's trading session are slightly negative. The European stock market indexes have lost 0.1-0.2% so far. There will be no new important economic data announcements. The broad stock market will likely extend its short-term fluctuations today. We may see some more profit-taking action following the recent advance. There have been no confirmed negative signals so far.
3rd party Ad. Not an offer or recommendation by Investing.com. See disclosure here or remove ads.
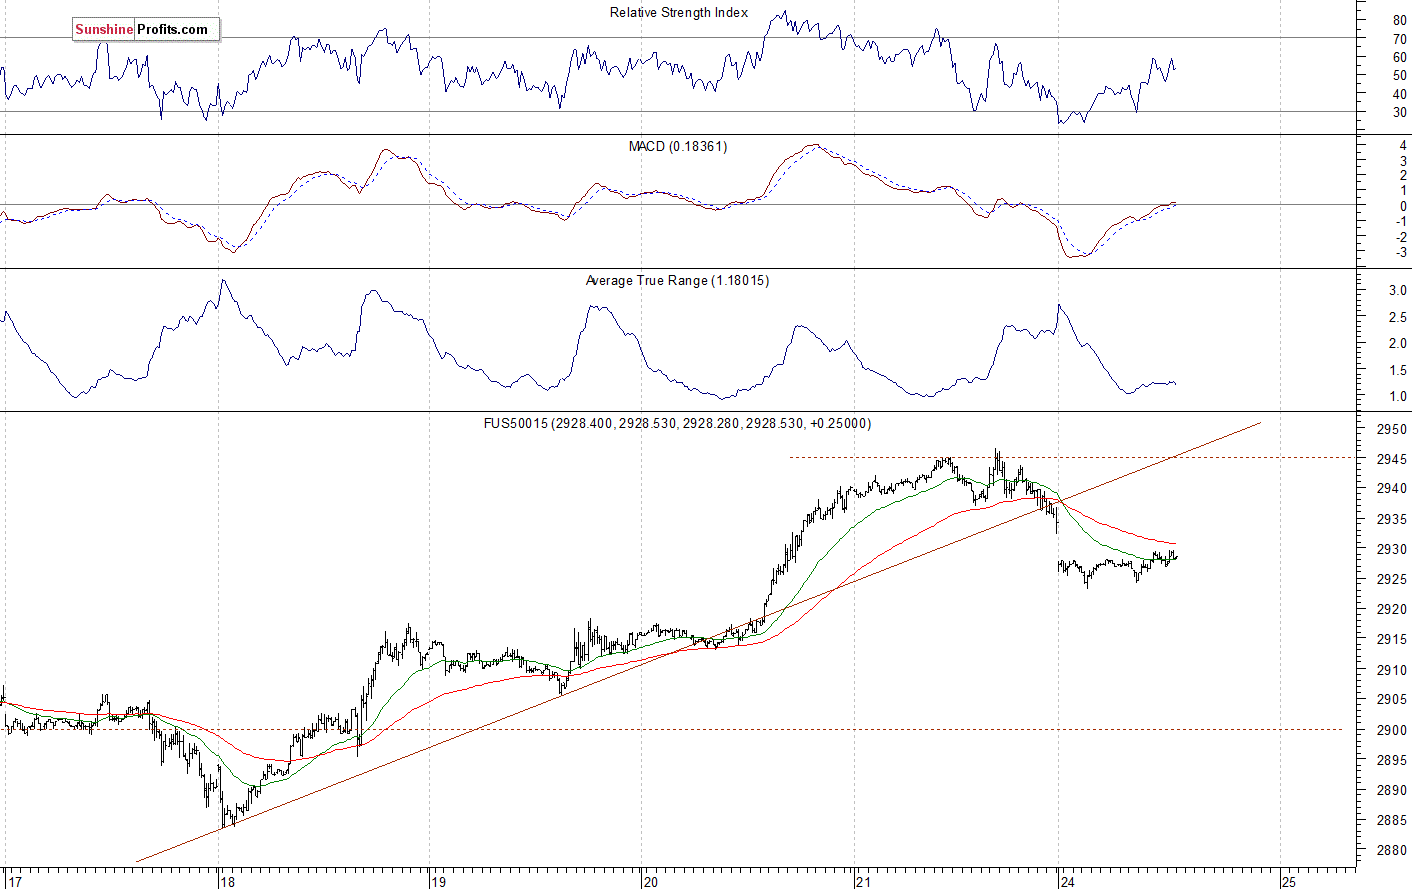
The S&P 500 futures contract trades within an intraday consolidation following an overnight decline. The nearest important level of resistance is at 2,935-2,945, marked by the record high. On the other hand, the support level is at 2,925, marked by the local lows. The support level is also at 2,900-2,910. The futures contract is now below its week-long upward trend line, as we can see on the 15-minute chart:
NASDAQ at 7,500 Again
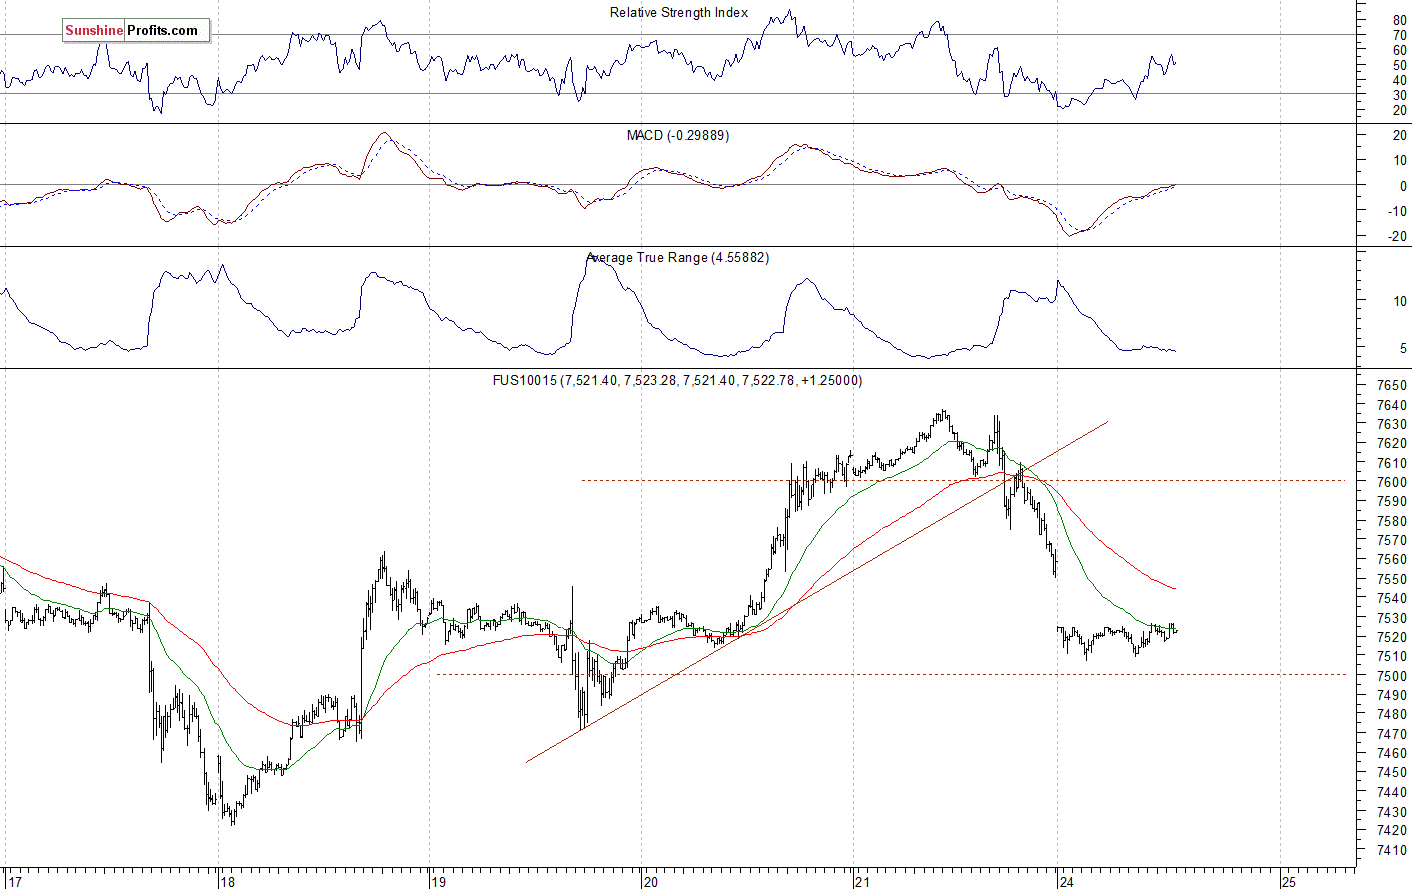
The technology NASDAQ 100 futures contract follows a similar path, as it fluctuates after an overnight decline. It remains relatively weaker than the broad stock market following almost 4% downward correction off the August 30th record high of around 7,700. The nearest important level of resistance is at around 7,550-7,570, and the next resistance level is at 7,600-7,650. On the other hand, support level is at 7,470-7,500, among others. The NASDAQ futures contract remains below its Friday's trading range, as the 15-minute chart shows:
Apple (NASDAQ:AAPL), Amazon - Still Going Sideways
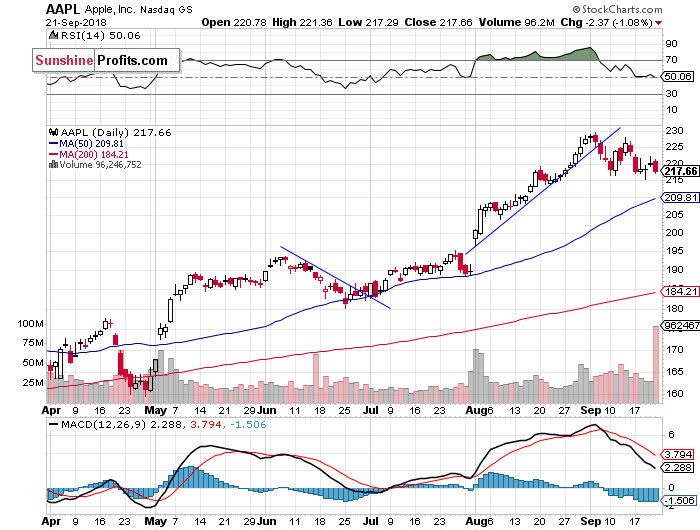
Let's take a look at Apple, Inc. stock (AAPL) daily chart (chart courtesy of http://stockcharts.com). It reached the new record high at the level of $229.67 on September the 5th, before reversing lower. Then it broke below its month-long upward trend line. The resistance level remains at $225-230. On the other hand, support level is at $215. If the price breaks lower, we could see more selling pressure:
3rd party Ad. Not an offer or recommendation by Investing.com. See disclosure here or remove ads.
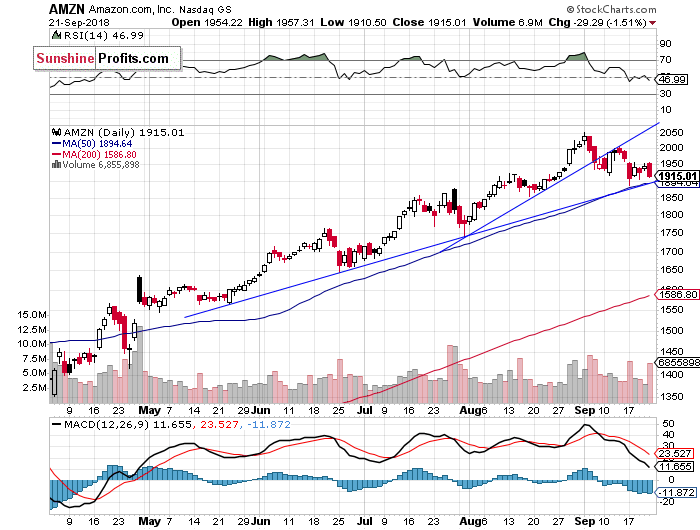
Now let's take a look at Amazon.com, Inc. stock (NASDAQ:AMZN) daily chart. It has reached the new record high at the price of $2,050.50 recently. Since then it was retracing this record-breaking rally. The stock broke below the month-long upward trend line in the early September. We still can see negative technical divergences. The price is at its medium-term upward trend line:
Dow Jones at New Record High Again
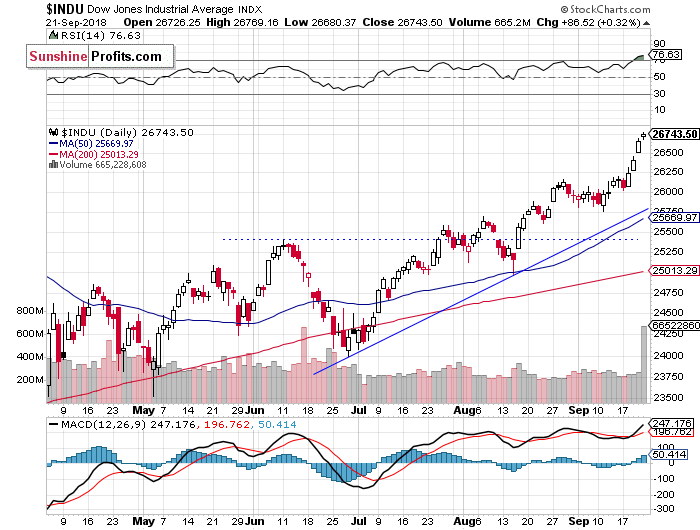
The Dow Jones Industrial Average extended its uptrend on Friday, as it reached the new all-time high at the level of 26,769.16. The nearest important level of support remains at 26,500, marked by the recent resistance level. The index accelerated the uptrend above its tree-month long upward trend line. We can see some short-term technical overbought conditions:
The S&P 500 index reached the new record high on Friday following the recent breakout above the late August local high of around 2,917. The broad stock market extends its over nine-year-long bull market, but will it continue much higher? There have been no confirmed negative signals so far.
Concluding, the S&P 500 index will likely open slightly lower today. Investors may take short-term profits off the table. However, it doesn't look like some meaningful downward reversal.
Which stock should you buy in your very next trade?
With valuations skyrocketing in 2024, many investors are uneasy putting more money into stocks. Unsure where to invest next? Get access to our proven portfolios and discover high-potential opportunities.
In 2024 alone, ProPicks AI identified 2 stocks that surged over 150%, 4 additional stocks that leaped over 30%, and 3 more that climbed over 25%. That's an impressive track record.
With portfolios tailored for Dow stocks, S&P stocks, Tech stocks, and Mid Cap stocks, you can explore various wealth-building strategies.