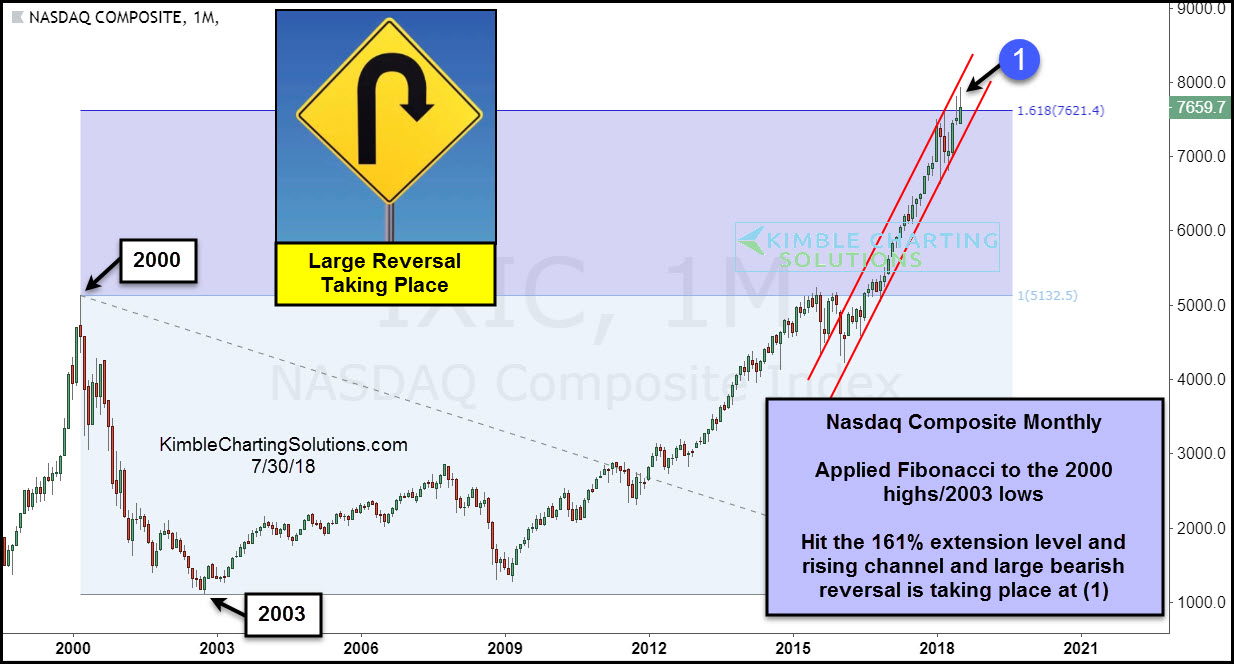
This chart looks at the Nasdaq Composite index on a monthly basis over the past 20 years, where we applied Fibonacci to the 2000 highs and 2003 lows.
This past month the index was testing the 161% Fibonacci extension level off the 2000 highs/2003 lows and the underside of a steep rising channel at (1).
While testing both of these levels this month, the index looks to be creating a large bearish reversal pattern (bearish wick) at dual resistance.
The trend for tech remains up. This is a price point where the bulls do not want to see selling get started.
Which stock should you buy in your very next trade?
AI computing powers are changing the stock market. Investing.com's ProPicks AI includes 6 winning stock portfolios chosen by our advanced AI. In 2024 alone, ProPicks AI identified 2 stocks that surged over 150%, 4 additional stocks that leaped over 30%, and 3 more that climbed over 25%. Which stock will be the next to soar?
Unlock ProPicks AI