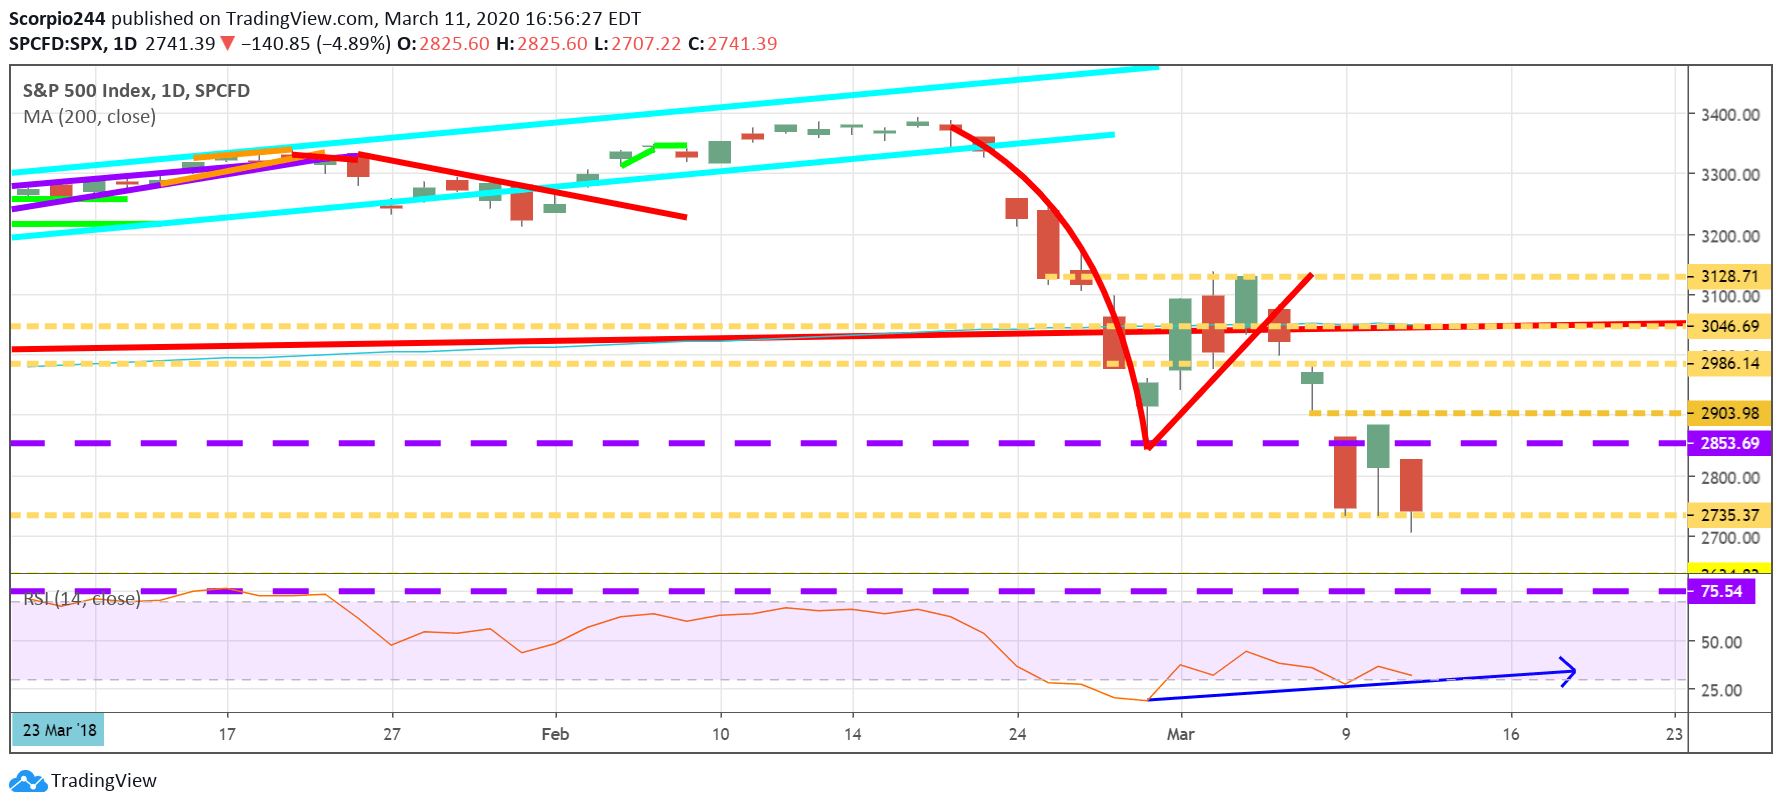
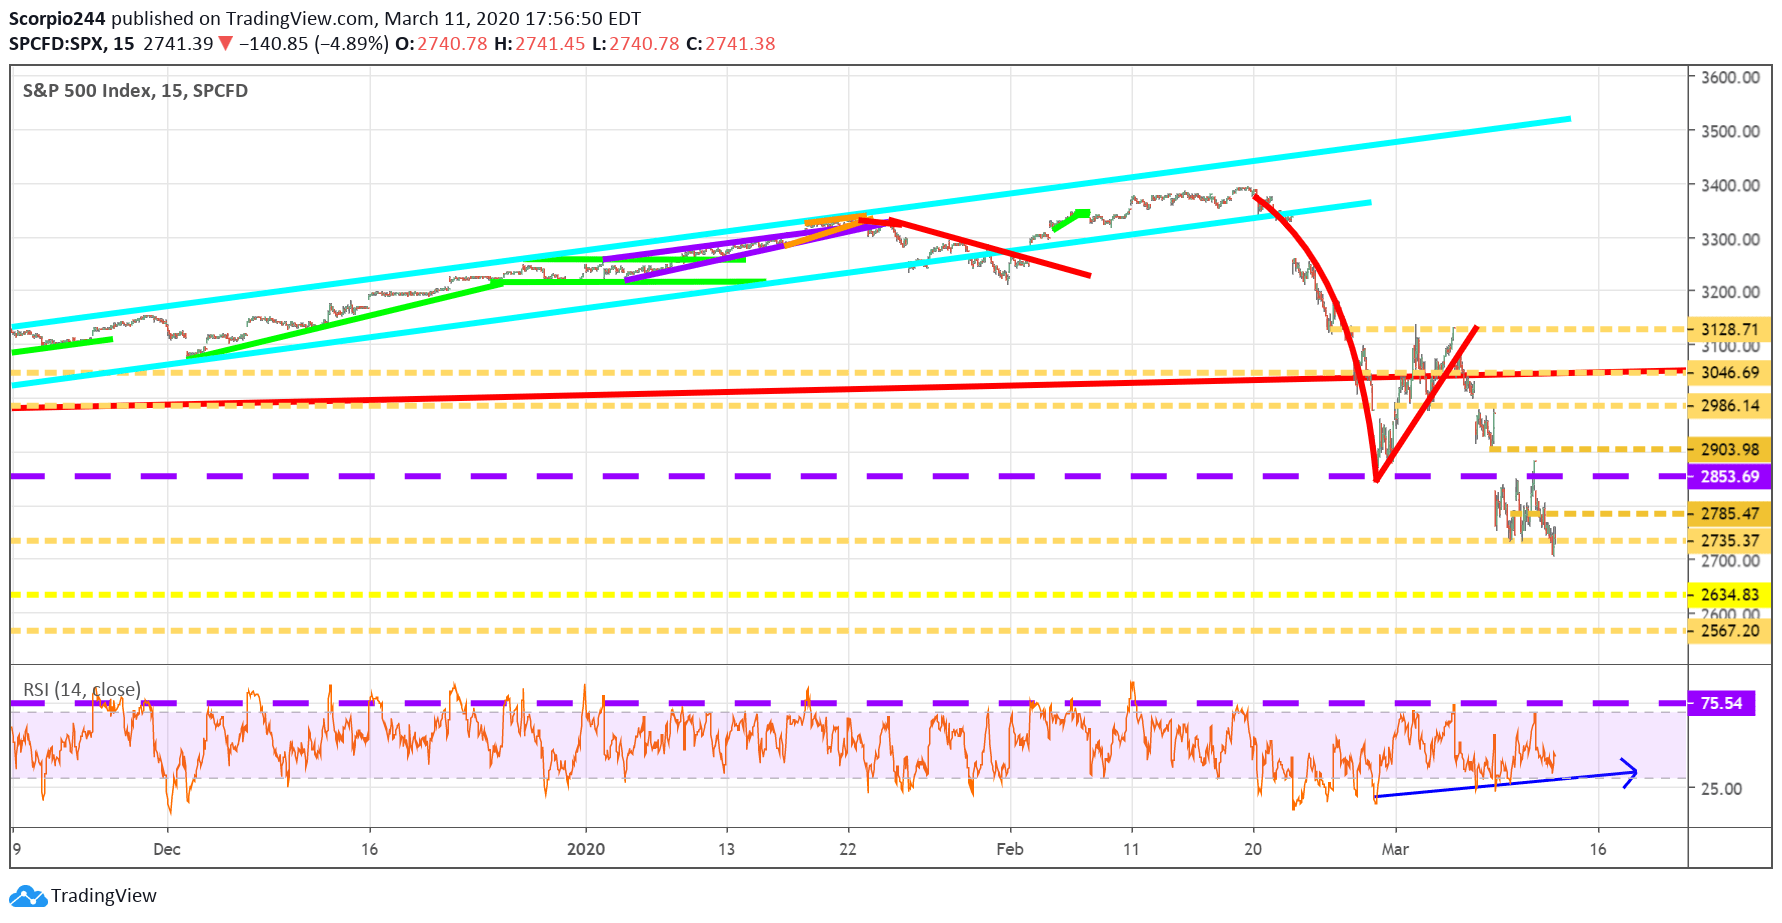
If you want the bad news, we broke the 2735 level intraday yesterday, which is not positive. If you want the good news, we closed at 2741. So from a closing basis, 2735 is still our support level. So “technically” we can say that support has held, but it sure doesn’t leave me all warm and fuzzy.
Again, the RSI is still trending higher, and while it is not that important at this exact moment in time, it is still a positive trend, and it is still a bullish divergence.
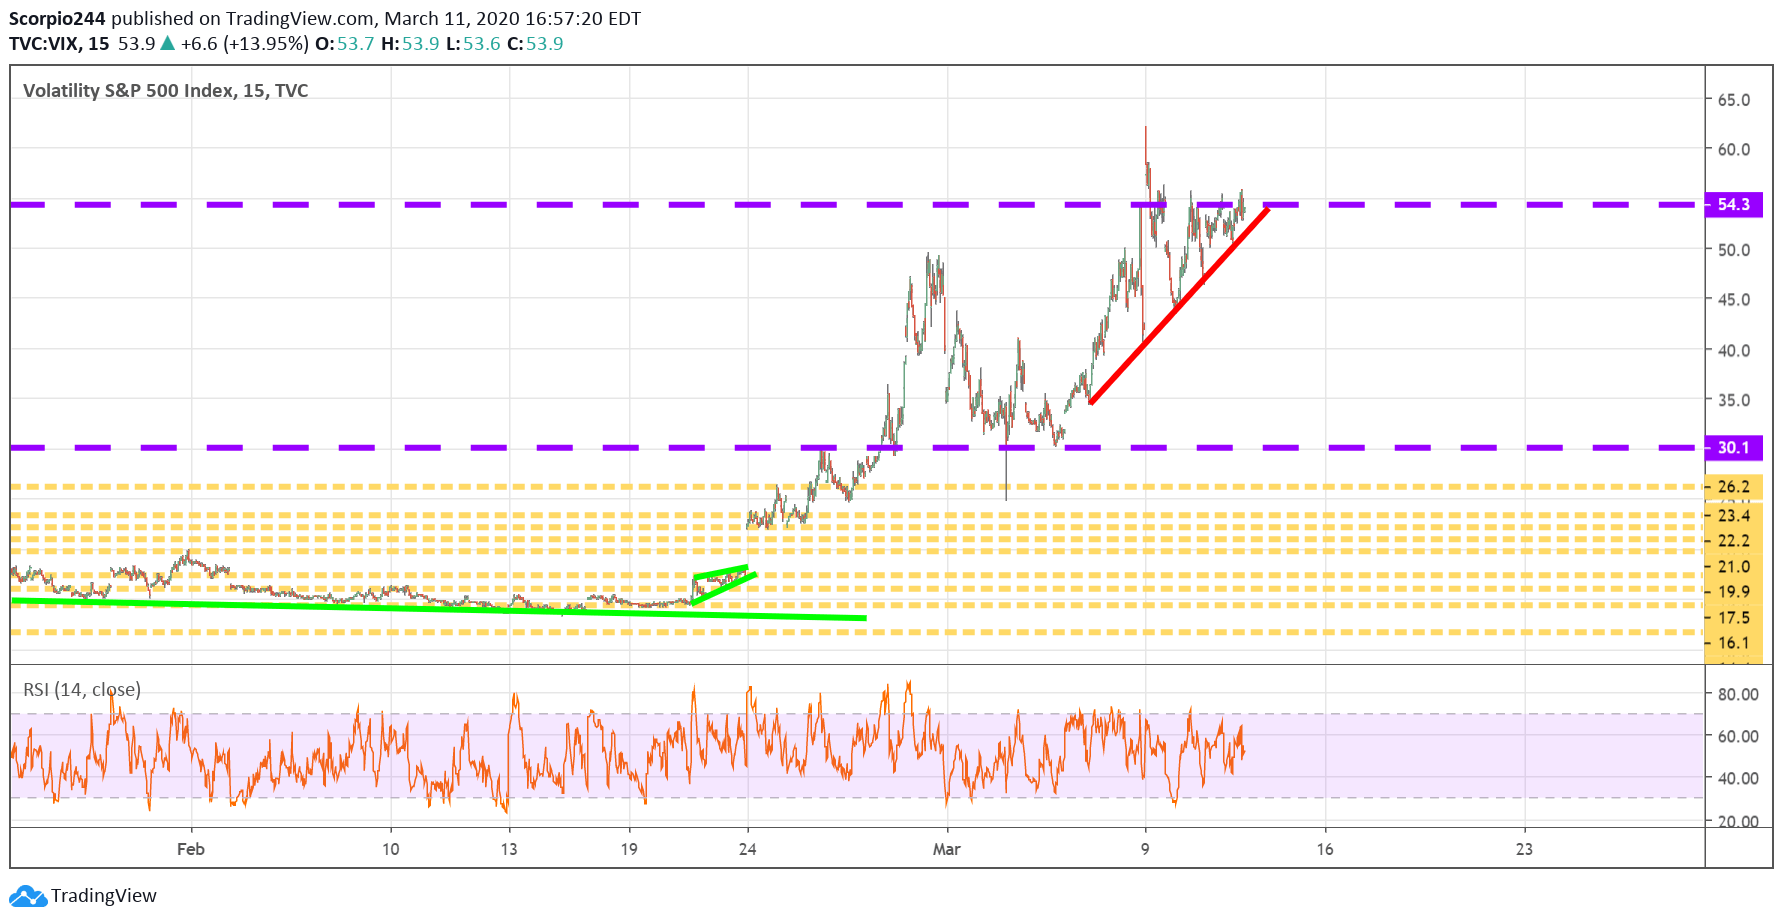
VIX
Meanwhile, the VIX never got to its old highs either.
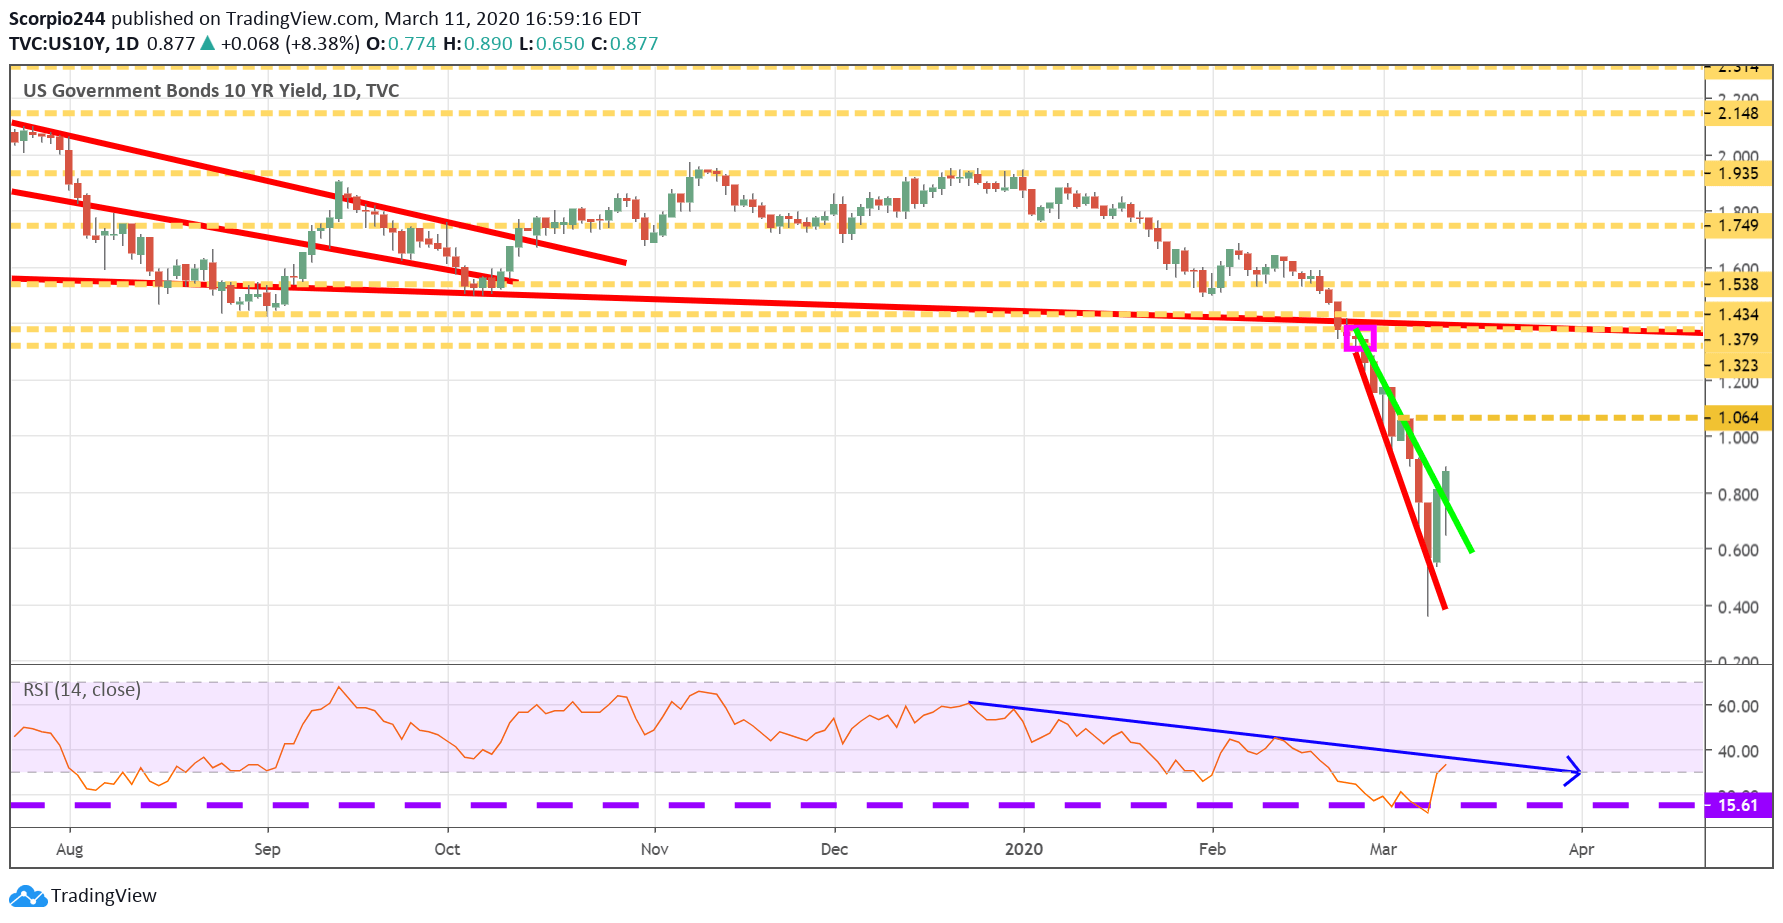
US 10-Year
Meanwhile, the 10-year finally broke that nasty downtrend, and even the RSI is beginning to pop higher.
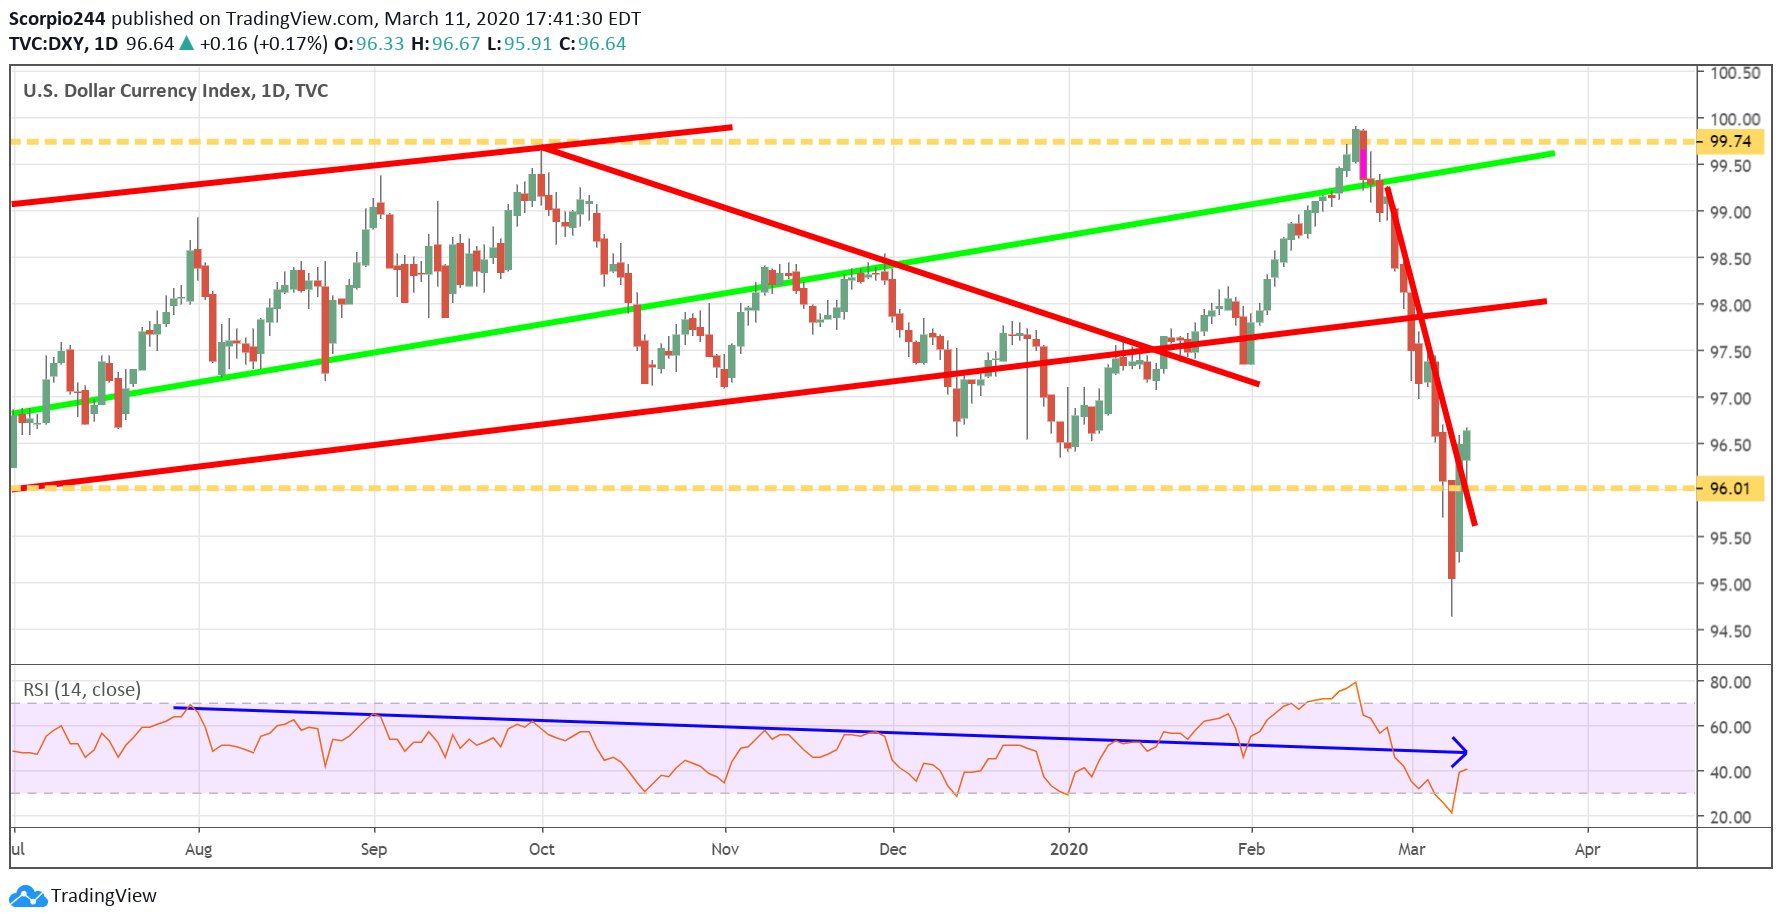
Dollar Index
The dollar index is also stabilizing and showing positive signs as well.
The spread between USDE10YR is also rising. To this point, this has been the only thing that has been working.
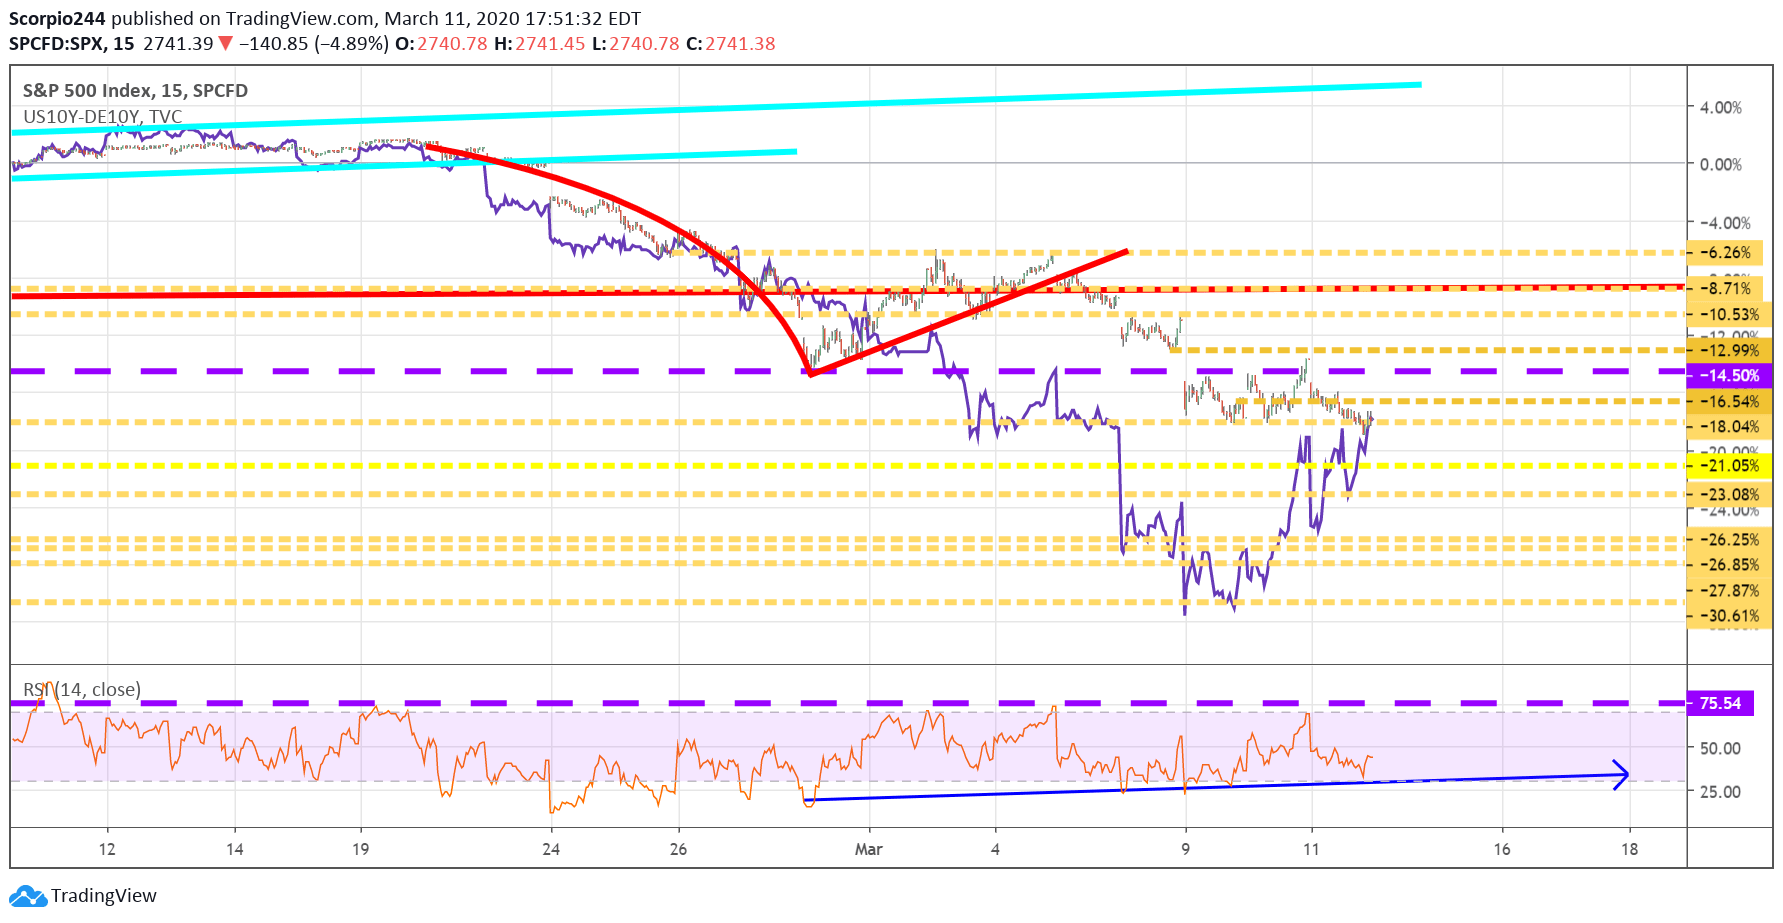
So, I ‘d hated to say it, but again, as long as yields are rising, spreads are widening, and the is dollar strengthening, and S&P 500 can stay above 2735, then the trend is higher. I know you think I’m crazy. But until we get a solid close below 2735, I’m not changing my view.
Now, remember, I am human, and a person. So that means there is a very good chance I will be wrong. Should I be proven wrong by the market, which has been happening a lot recently, be prepared for a drop even lower to 2635.
Apple (AAPL)
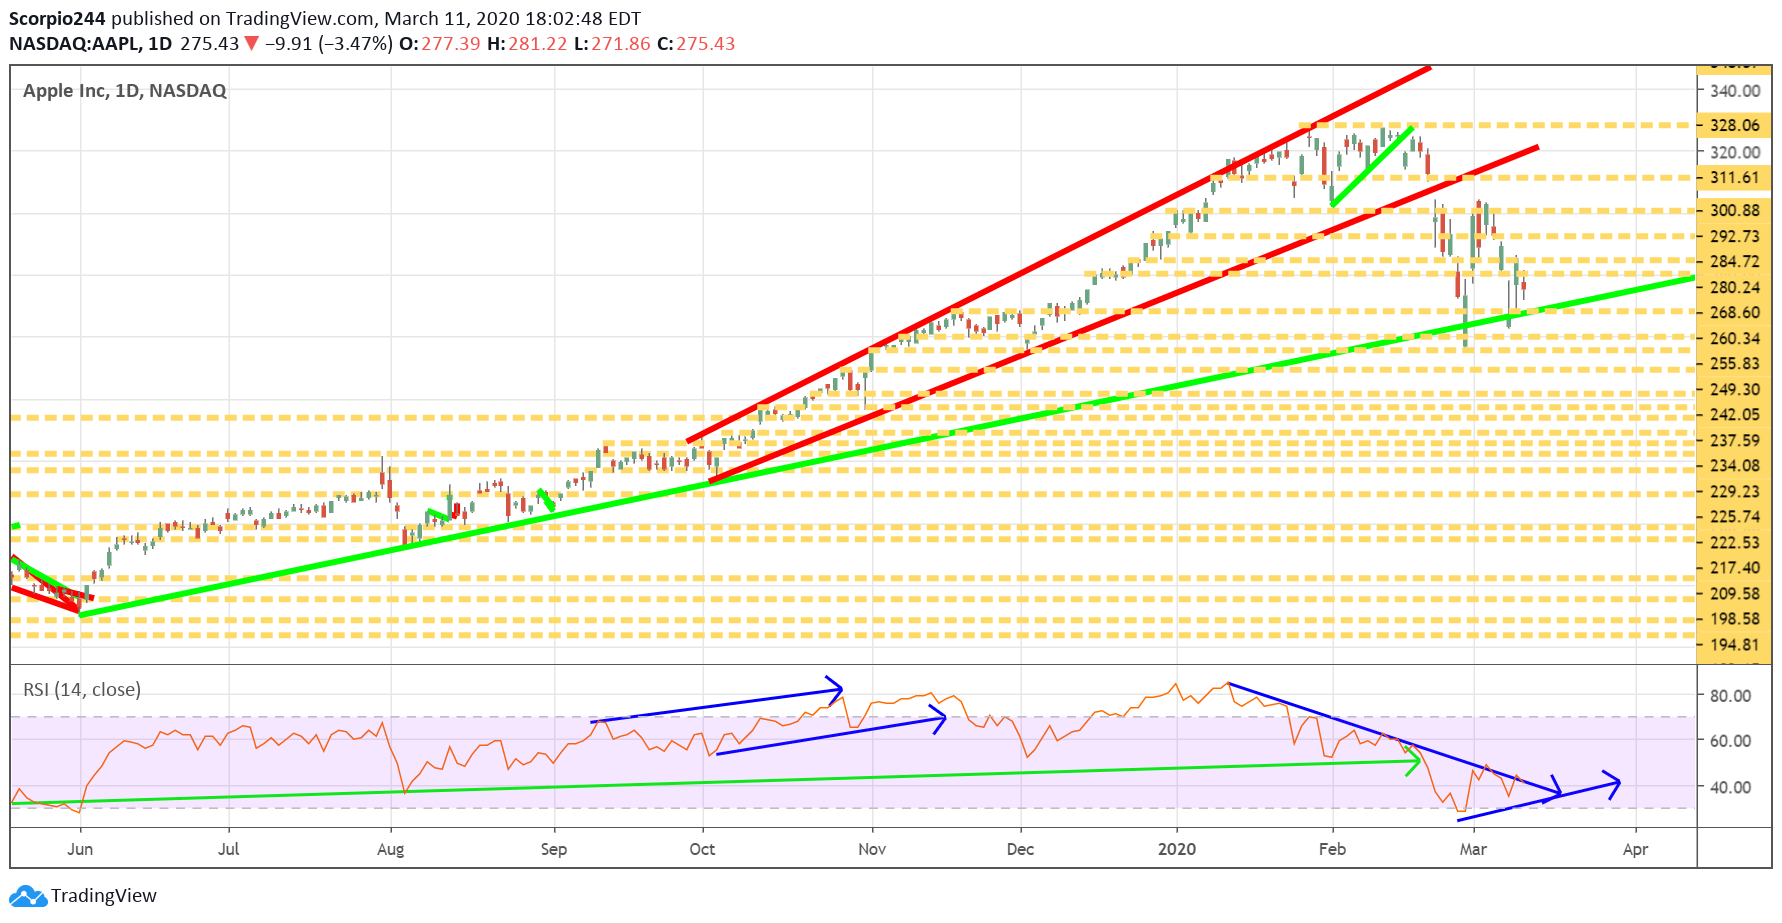
As a subscriber pointed out to me earlier yesterday, Apple (NASDAQ:AAPL) never made a new low yesterday. As its RSI begins to turn higher too, more importantly, you can see it holding that long-term uptrend off the June 19 lows.
Microsoft (MSFT)
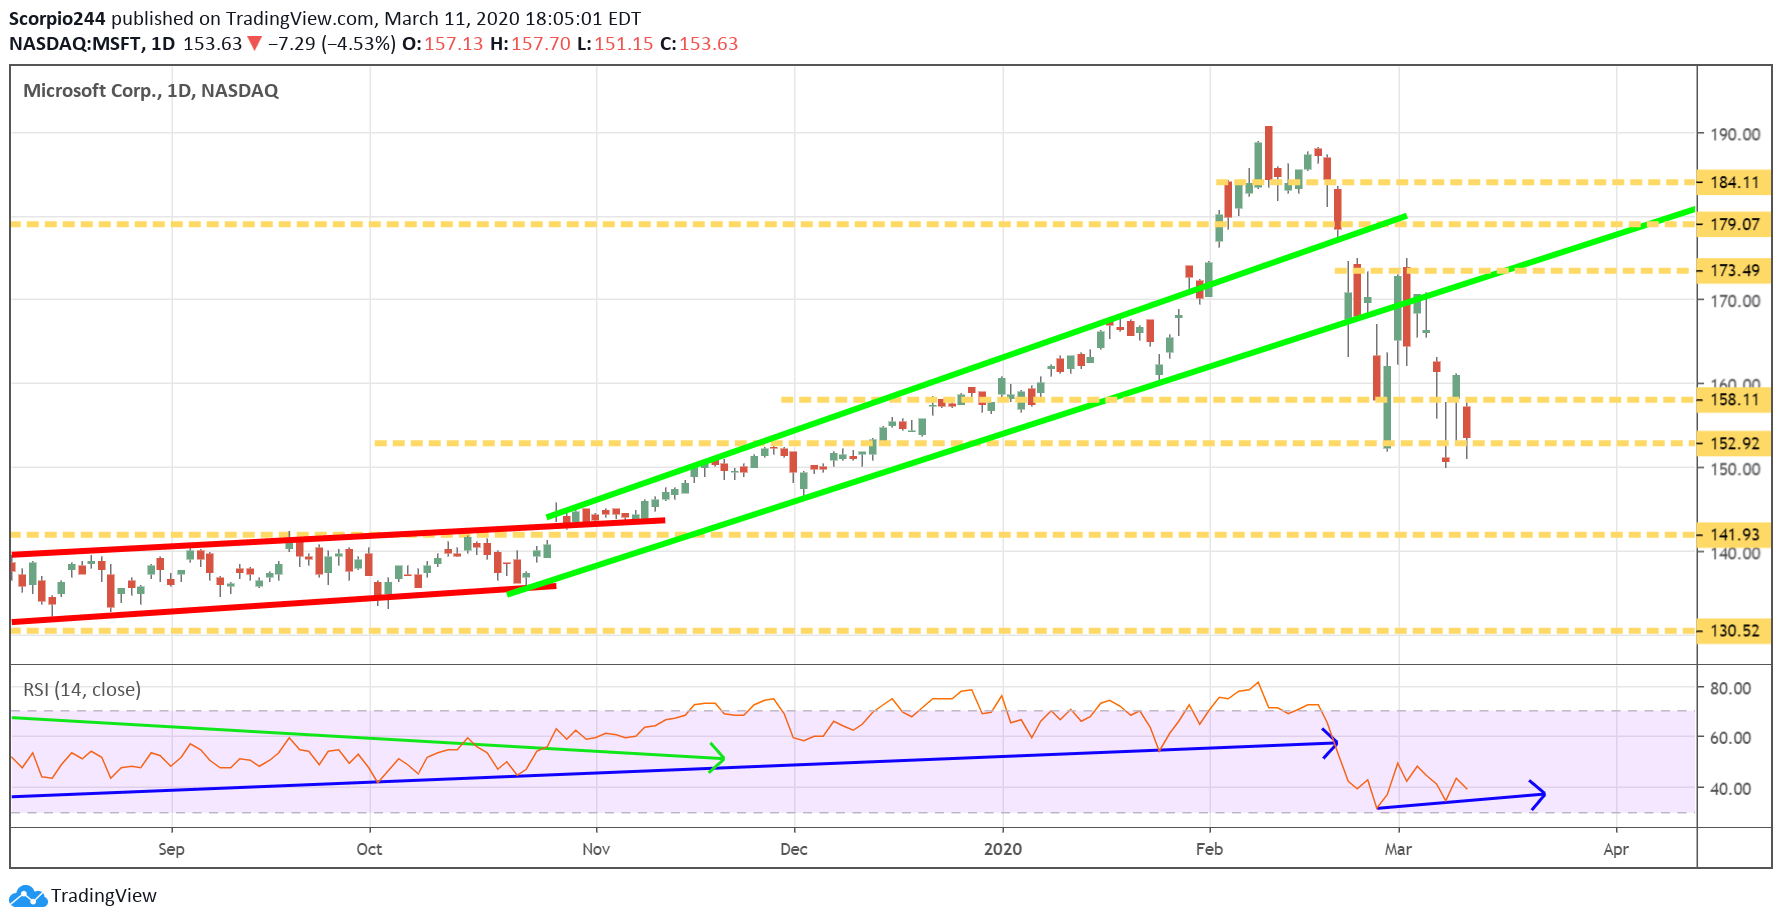
The patterns existd for Microsoft (NASDAQ:MSFT), with no new low, and RSI turning higher.
Boeing (BA)
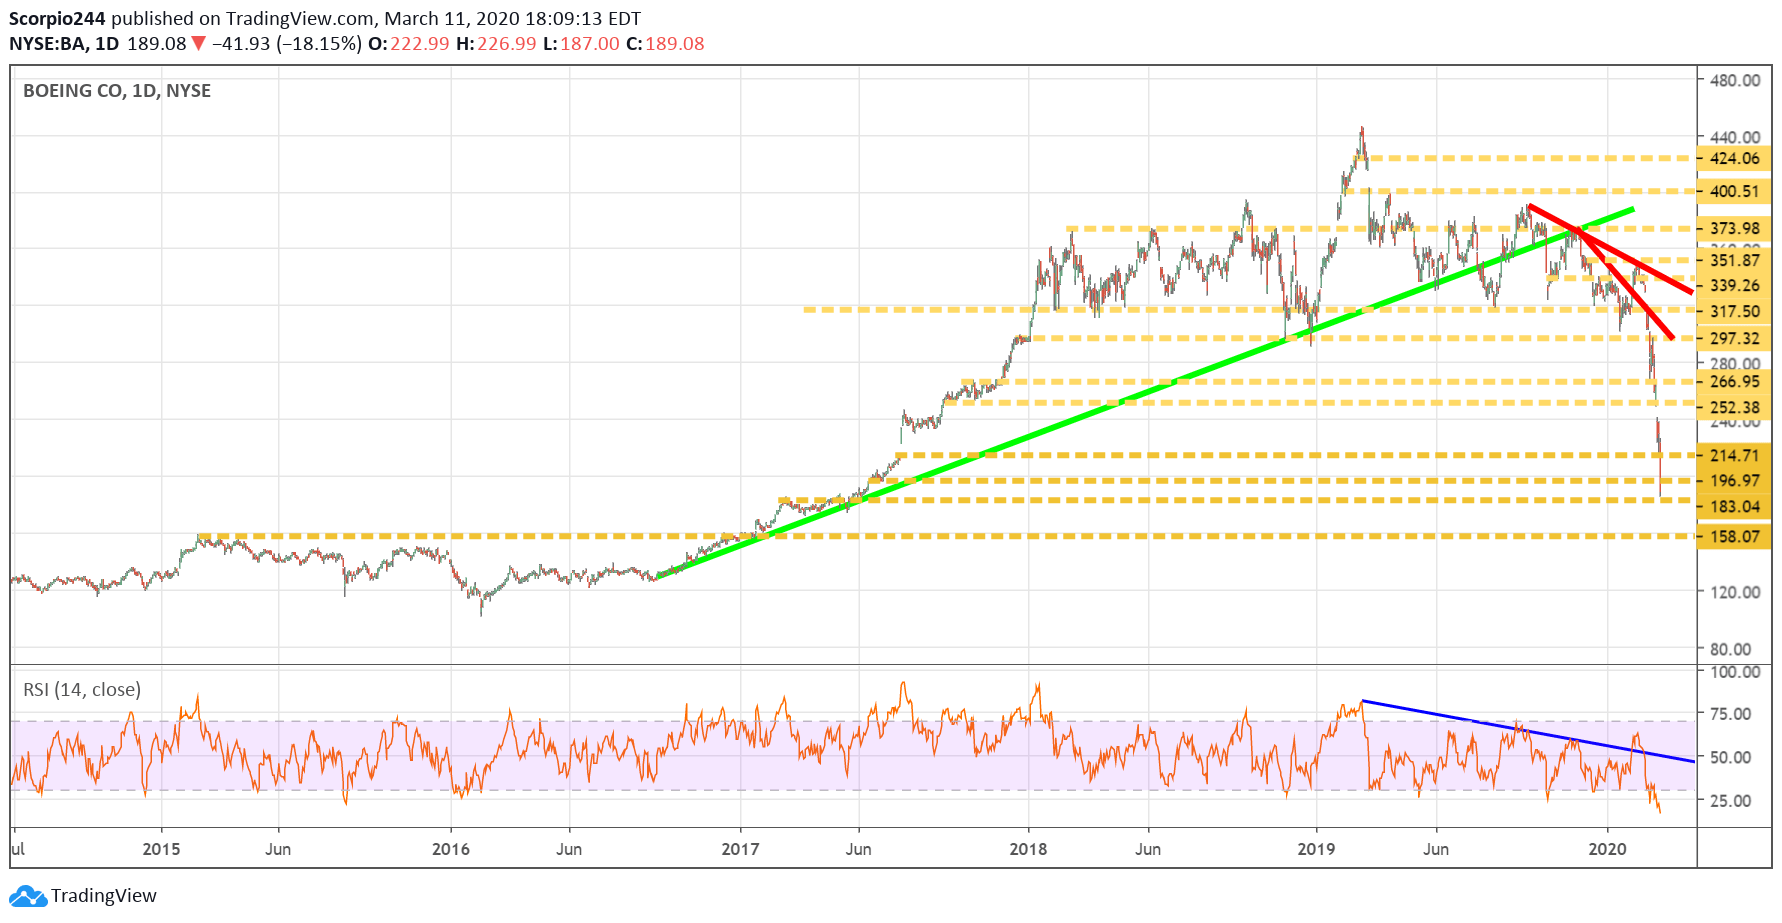
Boeing (NYSE:BA) has been destroyed, and if $183 isn’t the bottom then I’m sorry because it is going even lower back to $158.
Gold
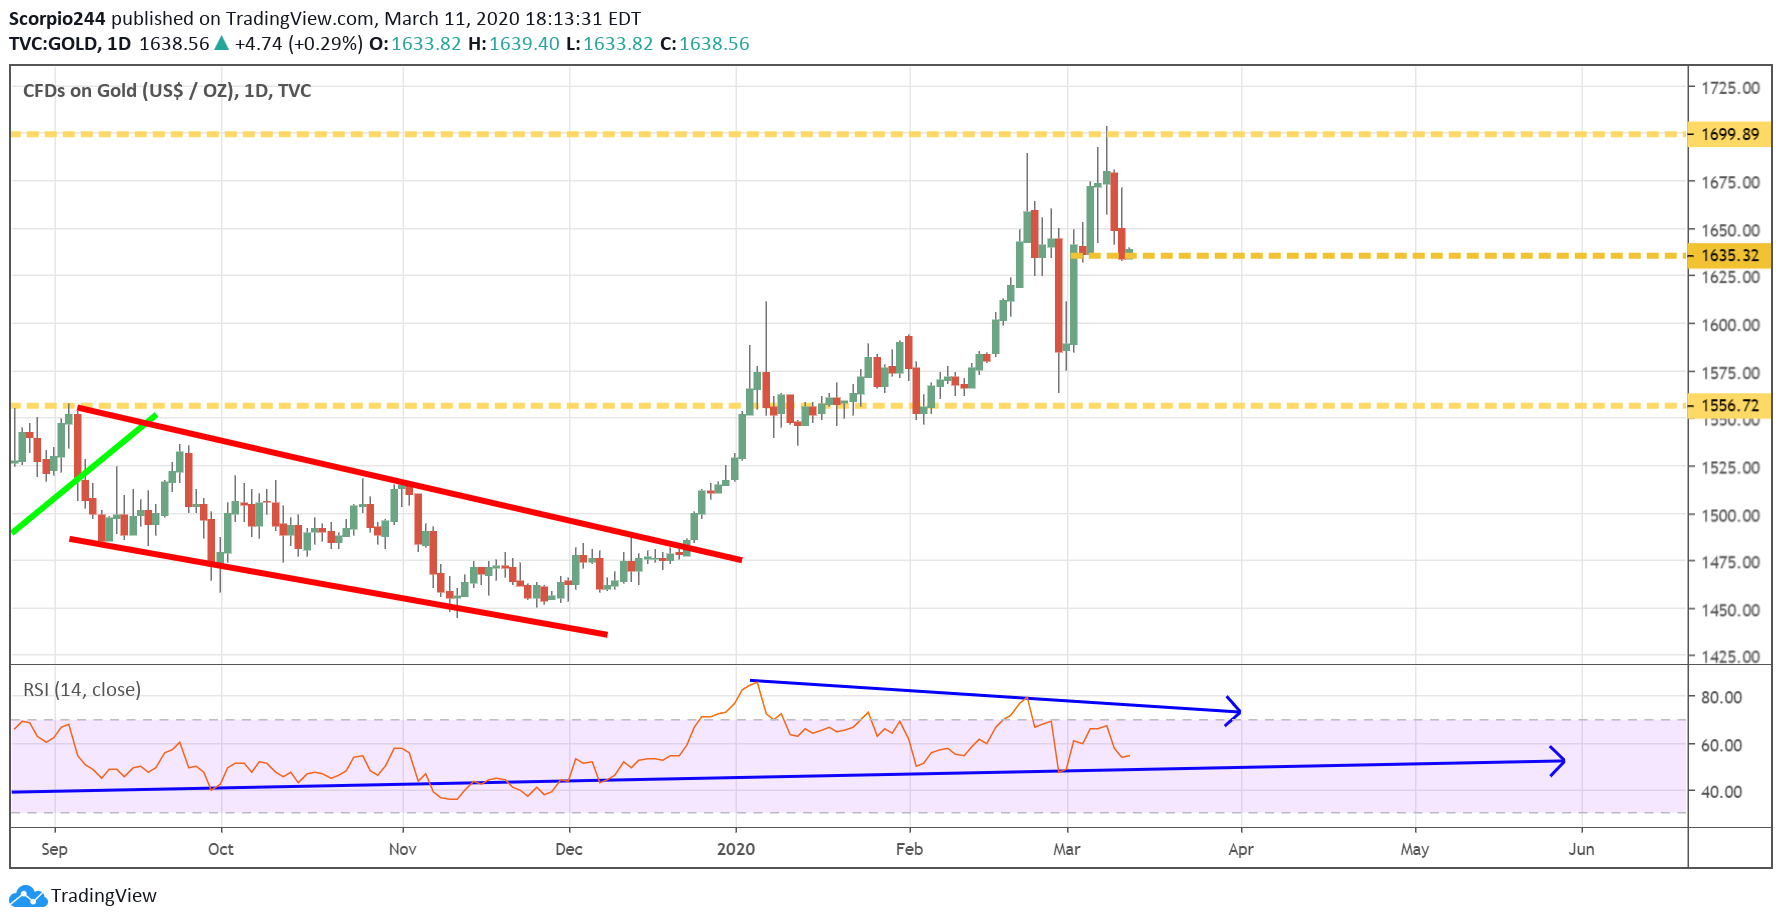
I think gold is heading lower, have you seen a chart of the 5-year breakeven inflation expectations. Not good for inflation, and that is not for gold, even in these times. Plus you have that nasty bearish divergence after failing multiple times at $1699.
Nasdaq (QQQ)
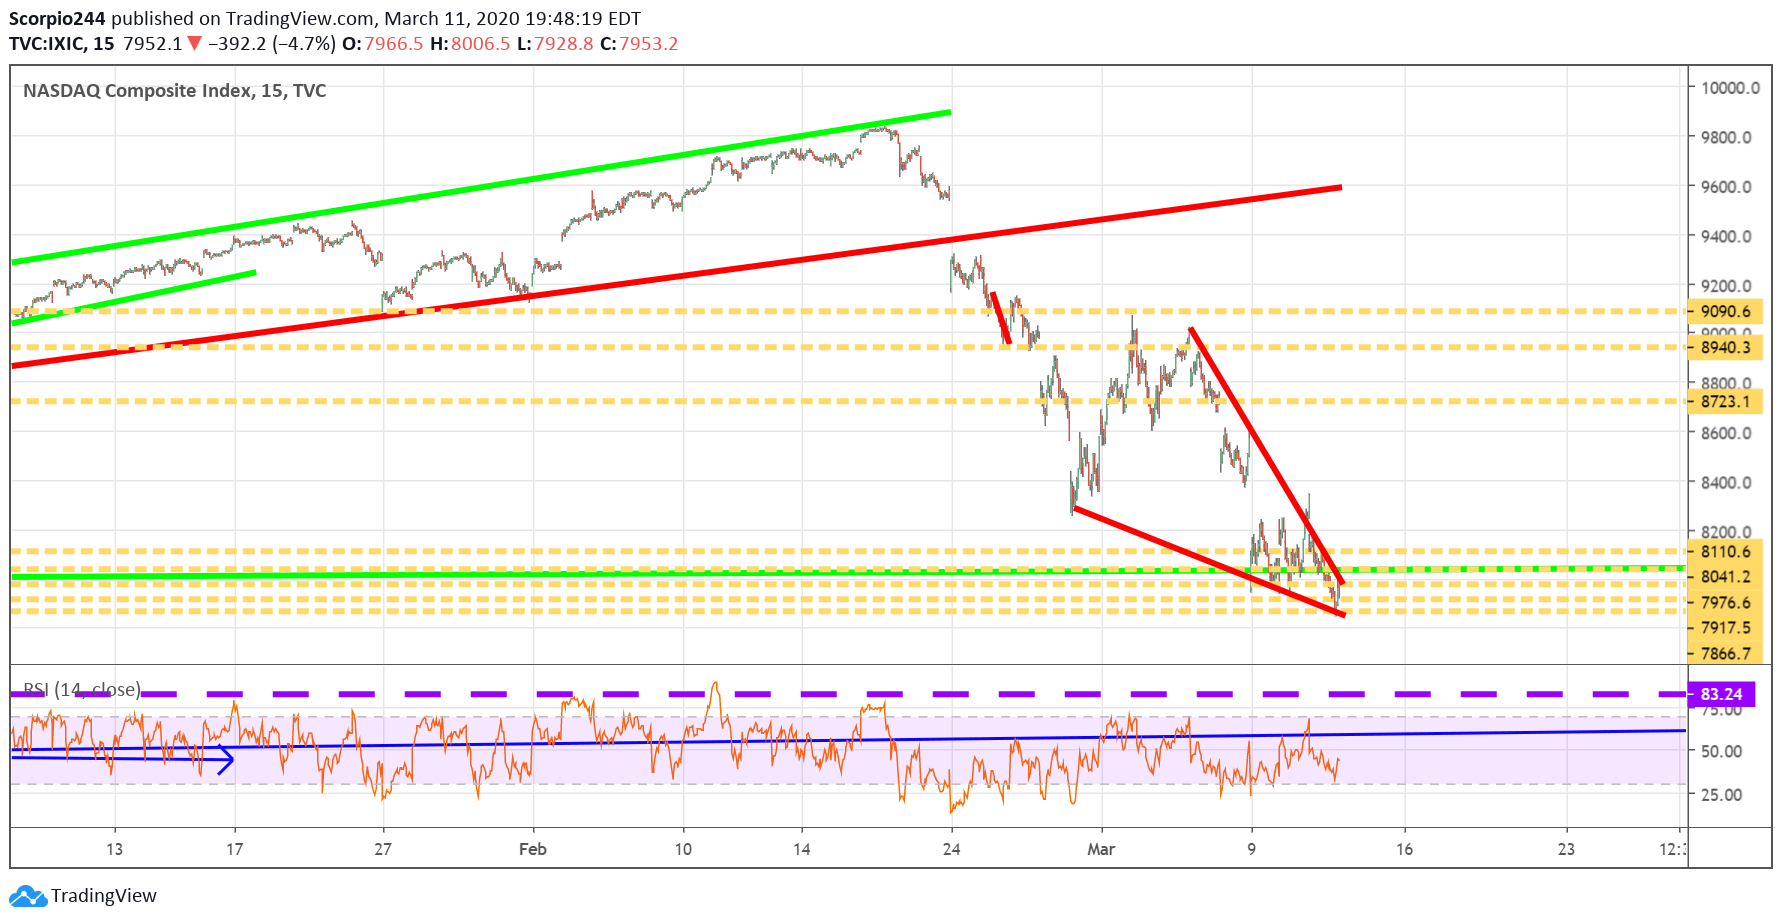
Then, of course, there is this tremendous falling wedge pattern that is forming in the NASDAQ.
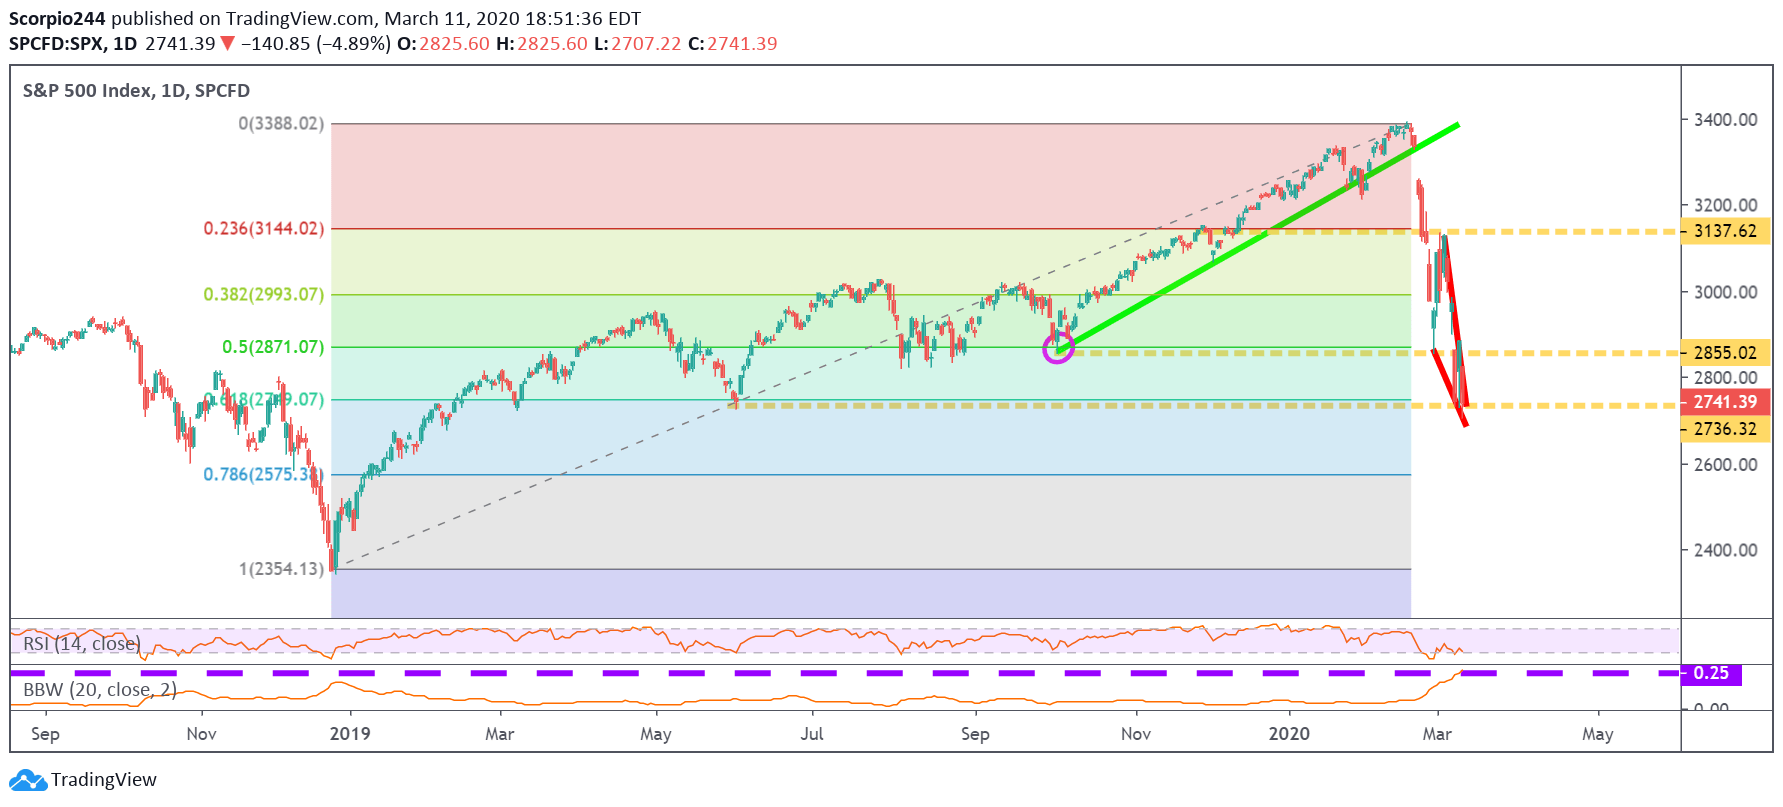
And while you will probably never see this from me again, desperate times, call for desperate measures. I’m not a big Fib or Elliot Wave guy, I did study it a lot when I was young, and I just never liked it. But the 61.8% retracement level on the SPX from the December 2018 lows to the February 2020 highs, is right around here at 2,740.
Which stock should you buy in your very next trade?
With valuations skyrocketing in 2024, many investors are uneasy putting more money into stocks. Unsure where to invest next? Get access to our proven portfolios and discover high-potential opportunities.
In 2024 alone, ProPicks AI identified 2 stocks that surged over 150%, 4 additional stocks that leaped over 30%, and 3 more that climbed over 25%. That's an impressive track record.
With portfolios tailored for Dow stocks, S&P stocks, Tech stocks, and Mid Cap stocks, you can explore various wealth-building strategies.

