Asia stocks cautiously advance ahead of Powell speech; Japan mixed on sticky CPI
Maybe it’s due to a global savings glut. Or perhaps fear continues to lurk in the hearts of overseas investors, inspiring a constant flow into safe-haven Treasuries in spite of firmer economic activity.
Whatever the explanation, the yield curve data of late looks out of place relative to the state of US economic affairs. Growth has picked up and the near-term risk of a new recession has been virtually nil recently. Yet the conspicuous flattening of the yield curve over the past year suggests that macro danger is approaching.
Perhaps the new reality is that the yield curve has lost its resonance as a business-cycle indicator. That’s still a minority view, but it’s hard not to wonder why the spread between long and short Treasury yields has narrowed over the last 12 months while the US macro trend has strengthened.
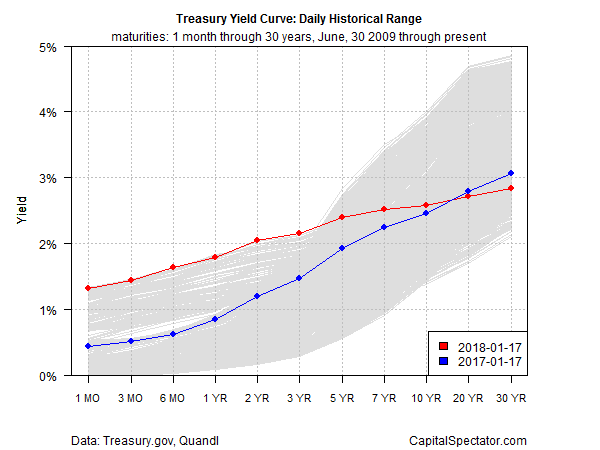
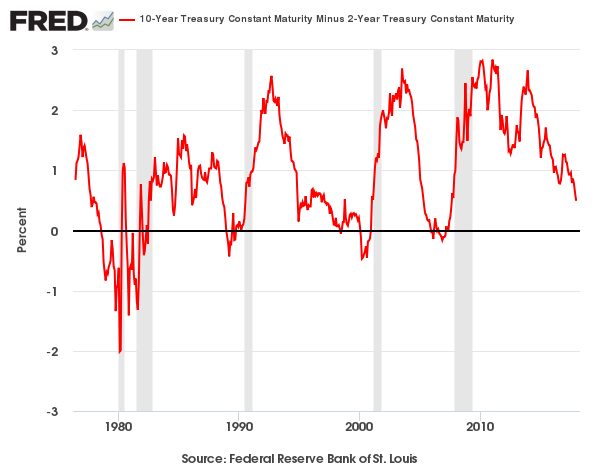
Yields on the short end of the curve have jumped 80 to 90 basis points over the past year through yesterday (January 17). Rates for the 5-year through 10-year maturities have inched higher over that period, but only slightly. Indeed, the benchmark 10-year has barely budged. Meantime, 20- and 30-year yields have dipped. As a result, the yield curve generally has become flatter. The spread for the widely followed 10-year/2-year Treasuries, for instance, is just 52 basis points, the lowest in nearly a decade.
This September marks the tenth anniversary of the collapse of Lehman Brothers, which seemed to unleash a dramatic collapse in the stock market and a near meltdown of the global economy. Ten years on, the US economy is humming and so is the global trend. But the yield curve seems stuck in the past, when the ability to shake off the Great Recession’s clouds weighed on sentiment far and wide.
Next week’s fourth-quarter GDP report is expected to post a healthy 3.0% gain, according to median forecast via CNBC’s January 17 survey of Wall Street economists. If correct, the US economy is on track to expand at a 3%-plus quarterly pace for a third time. The Q4 estimate equates with 40% improvement in growth for the cumulative increase for the trailing three quarters vs. the year-earlier period. Compared with the last three quarters of 2015, last year’s final three quarters are set for a 94% acceleration in growth.
Yet the yield curve seems to be signaling rising macro risk. History suggests that as the spread narrows, the risk of a new NBER-defined downturn rises. True, 10-year/2-year spread is still positive, but its dramatic slide over the past year implies that the economy is headed for trouble in the near term.
“The curve normally is the ultimate crystal ball portending recession,” Rich Taylor, client portfolio manager at American Century Investments, recently noted. “It tells us what the economy will do. And a curve this flat would suggest we have an impending recession.”
But Taylor and a growing number of other analysts are rethinking the wisdom of seeing an infallible seer in the curve data. Various reasons for the shift have been advanced, including the theory that unusually low and stable inflation have ripped up the script for yield-curve signals.
Another factor: low rates overseas. Indeed, the US 10-year rate at the moment is 2.60%, a relatively modest yield vs. history. But compared with Germany’s 0.58% or Japan’s 0.07% for 10-year bonds, America’s rates look quite attractive – even after factoring in the forex risk that a foreign investor must shoulder when buying Treasuries.
Whatever a narrowing yield curve implies (or doesn’t), the incoming data suggest that US macro risk remains low. Wednessay's December update on industrial production, for example, reflected a solid one-year trend: output increased 3.6% in year-over-year terms, the fastest gain in three years. Consumer spending is chugging along at a decent clip, too. Retail sales rose 5.4% for the year through last month, close to the strongest pace in the last four years.
Recession risk still deserves close monitoring, of course, since there’s always another downturn lurking down the road.But the yield curve's reliability may be on an extended holiday. Surprising? Not really? There are numerous indicators that offer valuable onsite for measuring business cycle risk, as I detailed in a book a few years ago. But the value of any one indicator waxes and wanes through time. The Treasury yield curve has been an exception, or so some analysts have said. But this time may be different.
Expecting the yield curve alone to tell us all that we need to know about measuring recession risk in real time was always a dubious exercise, and recent history doesn’t offer reason to think otherwise. A better solution is to routinely track a carefully selected set of metrics – here, for instance — and watching the numbers closely.
The yield curve still deserves a spot on short list. The mistake is expecting it to be a silver bullet for all time. The reality is that developing a high level of confidence about the state of the business cycle requires more than a quick glance at rate spreads.
Disclosure: Originally published at Saxo Bank TradingFloor.com
Which stocks should you consider in your very next trade?
Successful investors know to check multiple angles before making their move. InvestingPro's three powerful features work together to give you that edge:
ProPicks AI runs 80+ stock-picking strategies, including Tech Titans, which doubled the S&P 500's performance in just 18 months!
Fair Value combines 17 proven valuation models to help you spot overpriced stocks and undervalued gems.
And WarrenAI delivers instant insights on any stock. Ask questions, get vetted answers backed by real-time data (unlike ChatGPT).
Our subscribers use all three to identify stocks before double-digit gains and avoid costly mistakes.
But with 50% during our Summer Sale, even if you only use one of these features the value pays for itself. Sale ends soon—don't wait until prices go back up.
Save 50% while you can

