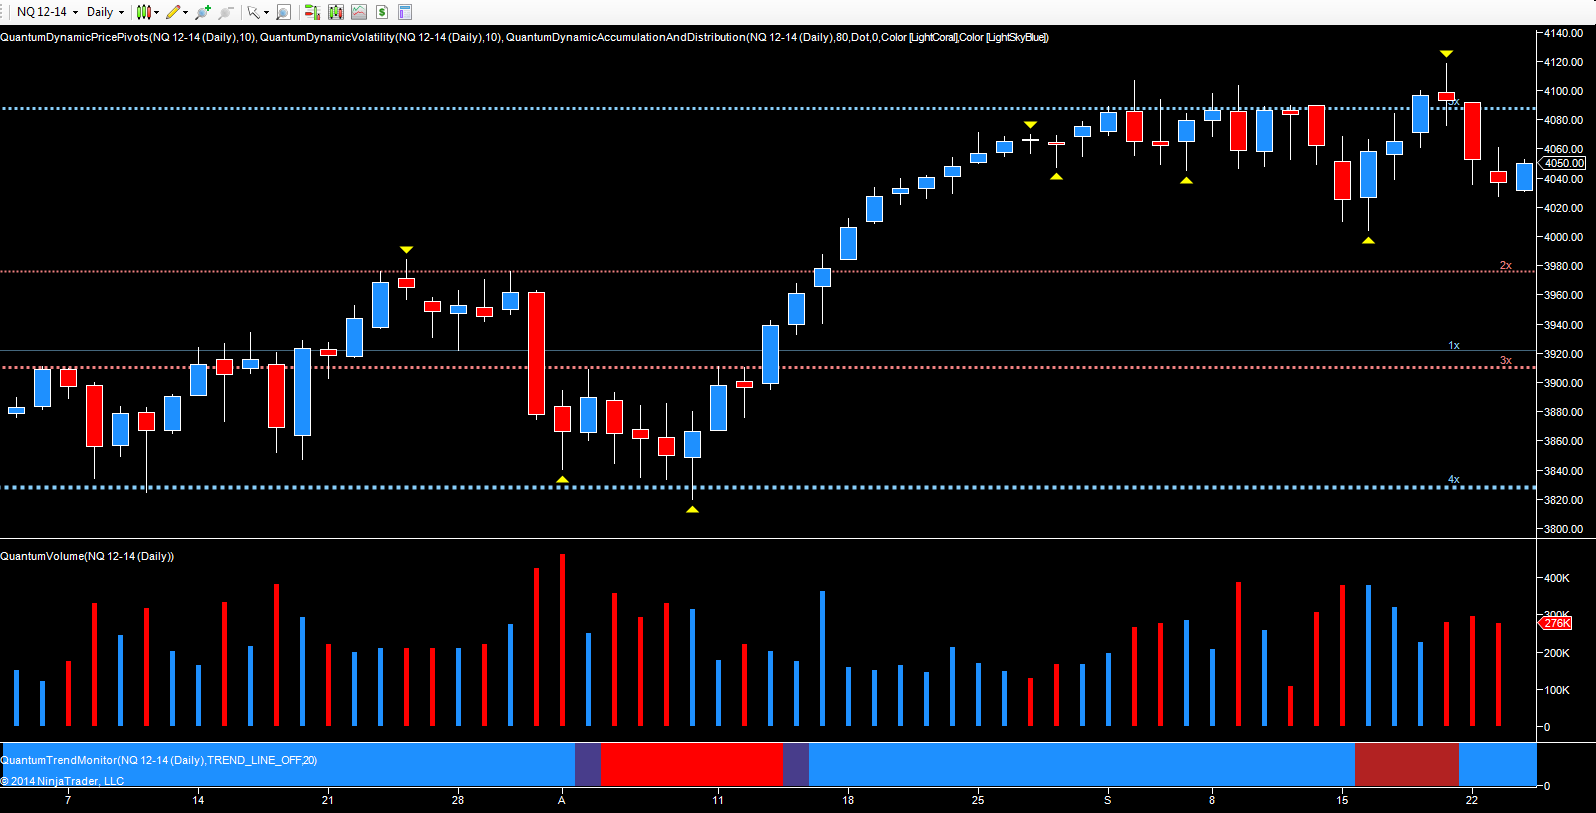
As always, whenever there is a market correction, and for whatever reason, the bears take heart, emerging from the undergrowth to call the top of the market once more! Yesterday’s price action saw them emerge again, following the reaction to the news in Syria with equity markets in general selling off sharply before finding some equilibrium later in the session, a reaction reflected in the VIX which jumped higher to close at 14.93. Whilst this was certainly true of the London market and the Dow, the reaction in the NQ and to a lesser extent in the ES were both muted. The NQ E-mini in particular was interesting, closing the session with a doji candle, and at odds with the rest of the market. Indeed, we have seem this divergence before, with the NQ E-mini leading the way, with other principle indices duly following. For the NQ, Monday’s price action was certainly in line with its sister indices.
The move lower was largely as expected, following the long legged doji candle of Friday last, with the index testing the 4120 region before closing perched delicately on the support zone at 4088. Monday’s price action, then delivered the pivot high, which was duly confirmed in yesterday’s trading session, and on Globex this morning, whilst the index has opened gapped down at 4031.75, so far it has closed this gap to trade at 4043.75 above the close of yesterday.
The volume profiles too are interesting, and once again confirm the price action on the chart. The move higher of last week, was accompanied by falling volume, a classic sign of weakness for VPA traders, with Monday’s candle confirming market exhaustion and indecision. However it is interesting to note the volumes of the last three days, all of which are equally weighted, and given the ‘shock’ news, one would expect these to be significantly higher, and certainly so on Monday. In addition, what Tuesday’s candle and volume also signals, is that the selling pressure, limited that it is, has now dried up, with buyers coming in at this level, and sending a clear signal, for this index at least, that this is nothing more than yet another minor pause and correction triggered by the news.
The key for today, will be the recovery, its strength in terms of the price action, and of course, the associated volume. If this move lower is indeed short lived, then a wide spread up candle with above average volume will confirm this picture, and any move beyond 4088 in the short term, will then confirm.
Which stock should you buy in your very next trade?
With valuations skyrocketing in 2024, many investors are uneasy putting more money into stocks. Unsure where to invest next? Get access to our proven portfolios and discover high-potential opportunities.
In 2024 alone, ProPicks AI identified 2 stocks that surged over 150%, 4 additional stocks that leaped over 30%, and 3 more that climbed over 25%. That's an impressive track record.
With portfolios tailored for Dow stocks, S&P stocks, Tech stocks, and Mid Cap stocks, you can explore various wealth-building strategies.
