
T2108 Status: 71.0%
VIX Status: 12.8
General (Short-term) Trading Call: Short (bearish bias).
Active T2108 periods: Day #138 over 20%, Day #1 over 70% (overbought)
Commentary
T2108 avoided overbought status for 52 straight trading days until peeking over the requisite 70% threshold today.
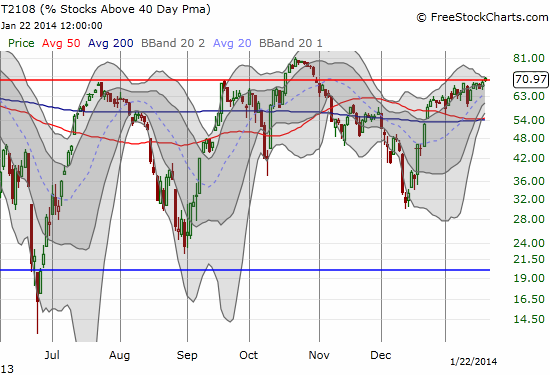
The higher lows makes it look like T2108 has been pressured upward for many months
I thought hitting this point would bring resolution to an important juncture, but the tease just barely continues. The S&P 500 barely advanced on the day and remains stuck right near the top of the “bear/bull” zone that I defined earlier.
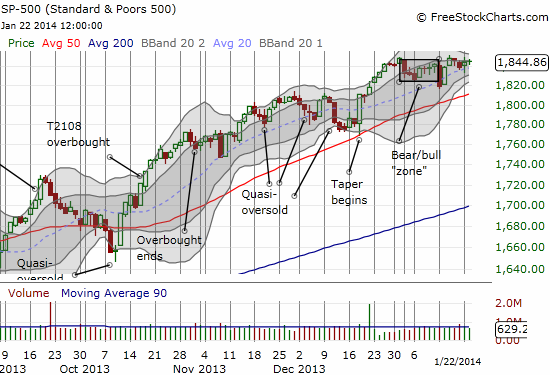
S&P 500 continues to crawl along
The S&P 500 (SPY) enters this overbought period after printing a very high performance for the 70% underperiod. I would like to think this means performance from the overbought period has been “pulled forward,” especially with earnings season in full throttle now. Instead, I think the better perspective recognizes that once/if the S&P 500 follows through in this overbought period, the index could take off for another legendary extended overbought rally. For now, I am maintaining the bearish bias UNTIL the follow-through occurs. After that, I will follow the standard overbought strategy: bullish first, bearish with a return to the 70% underperiod and/or bearish on appropriate technicals before overbought day #20.
I end with two earnings-related chart reviews.
First up, Netflix (NFLX). The stock traded up an incredible 18% or 60 points in after-hours after the company reported earnings. This puts the stock at a fresh all-time high. While Carl Icahn will likely use this fresh gift to once again sell shares into the increased liquidity generated by post-earnings reactions, I do NOT think it is as clear a shorting opportunity as the last post-earnings response. Last time, NFLX soared almost 12% above its upper-Bollinger Band (BB). That move is about as over-extended as they come! This time, NFLX will be trading just above the upper-BB. Do not be surprised to see additional momentum before the stock pulls back for a rest. With Icahn overhang out of the way, it is very possible upward momentum will continue.
I last charted NFLX two weeks ago when it broke below its 50DMA. The stock barely followed through on the selling; three times in the last five trading days, buyers rushed in and picked NFLX off the bottom. I guess I should have taken those moves as a bullish pre-earnings sign! I will now be alert for applying this template in other pre-earnings scenarios featuring a stock that should be selling off.
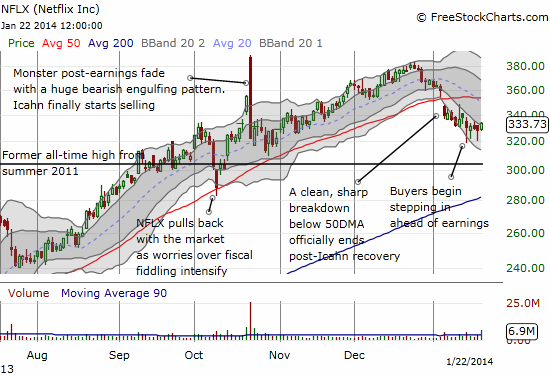
A pre-earnings setup
Lastly, International Business Machines (IBM). IBM is turning into a good trading stock. Two months ago I wrote “Simple Reasons to Like IBM Despite the Headwinds” and have written a few chart reviews since then. I had a modicum of success buying dips but over-extended myself buying a call spread ahead of earnings. That over-confidence has cost me a worthless position but a valuable (re)lesson. There was no real dip to buy here. In fact, IBM had just failed at the 200DMA for the second time this month, triggering what should have been a bright red technical flag to short the stock. The post-earnings trading reaction is indicative of a stock that still has dip-buyers. The stock over-extended a bit below the lower-BB and bounced right into natural resistance/support at the 50DMA. It is all about the follow-through from here. I will not go long again until a strong close above the 50DMA. Otherwise, the recent W-bottom is likely to get retested relatively quickly.
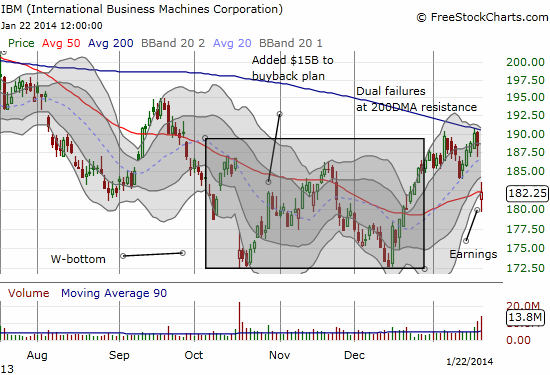
IBM fails the test
")
Weekly T2108
Be careful out there!
Full disclosure: long SPHB and SPLV and SSO puts (pairs trade)
Which stock should you buy in your very next trade?
With valuations skyrocketing in 2024, many investors are uneasy putting more money into stocks. Unsure where to invest next? Get access to our proven portfolios and discover high-potential opportunities.
In 2024 alone, ProPicks AI identified 2 stocks that surged over 150%, 4 additional stocks that leaped over 30%, and 3 more that climbed over 25%. That's an impressive track record.
With portfolios tailored for Dow stocks, S&P stocks, Tech stocks, and Mid Cap stocks, you can explore various wealth-building strategies.