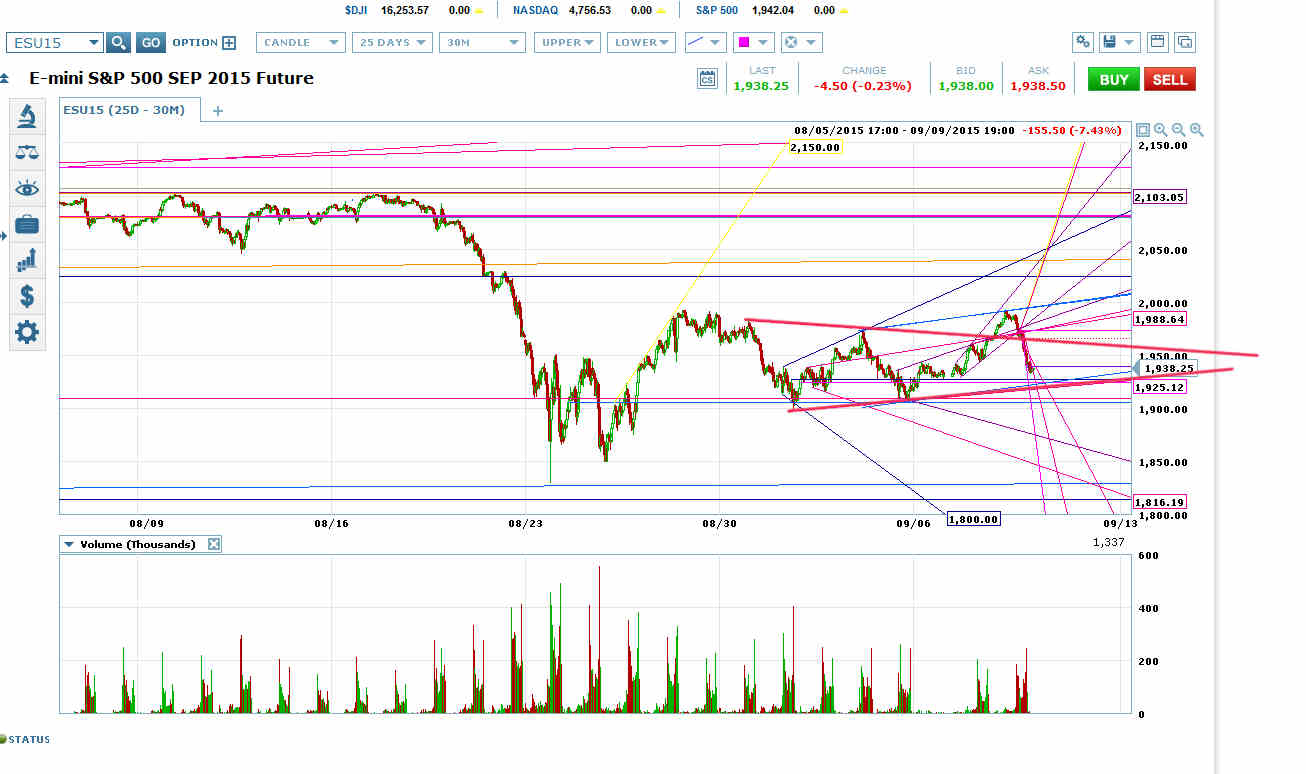
ES Initial Fake Breakout from Red “Triangle”
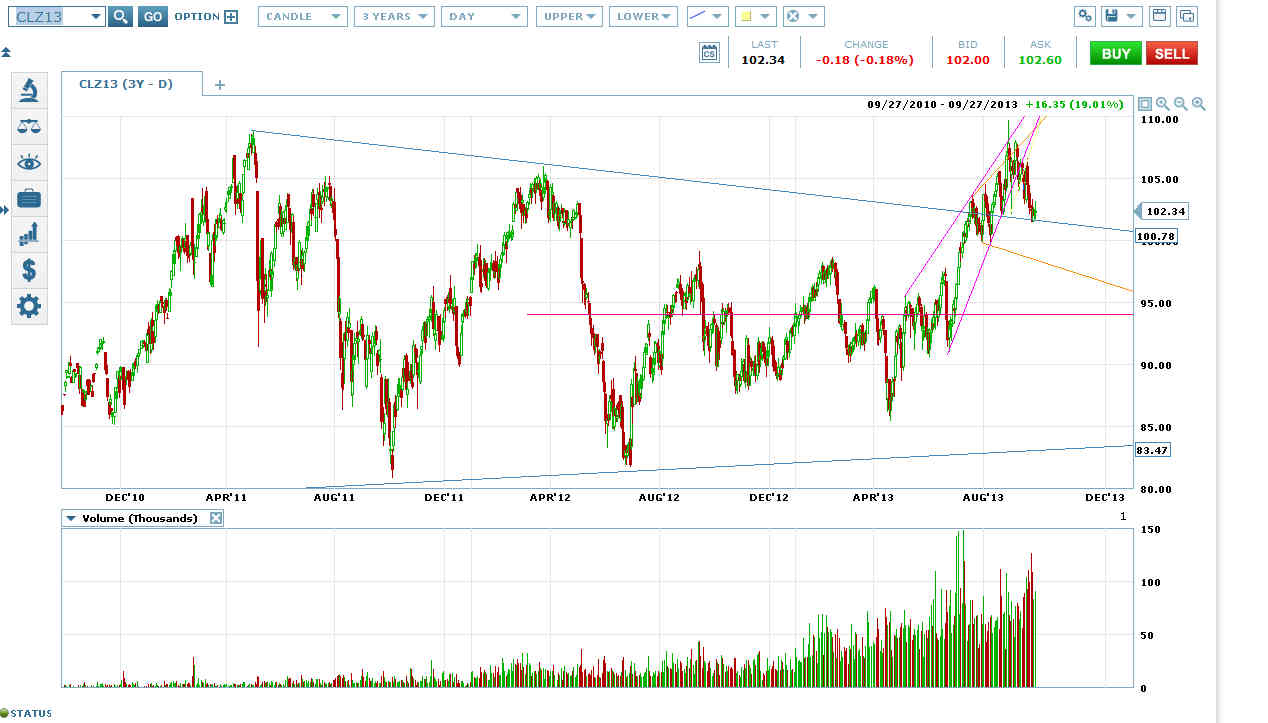
I’ve been comparing the recent ES price action with a multi-year topping formation in oil. You tend to see this type of topping action after “upwards crashes” that are partial retraces of bigger downwards crashes on any time frame.
Above is the first chart I posted of the ES topping formation, right after ES had completed a head and shoulders at the top of its red “triangle” and broken back into the center of the formation. Below is the first chart I posted of the oil topping formation, right as it was completing a similar H&S after a similar fake breakout.

Crude Oil Initial Fake Breakout from Blue Topping “Triangle”
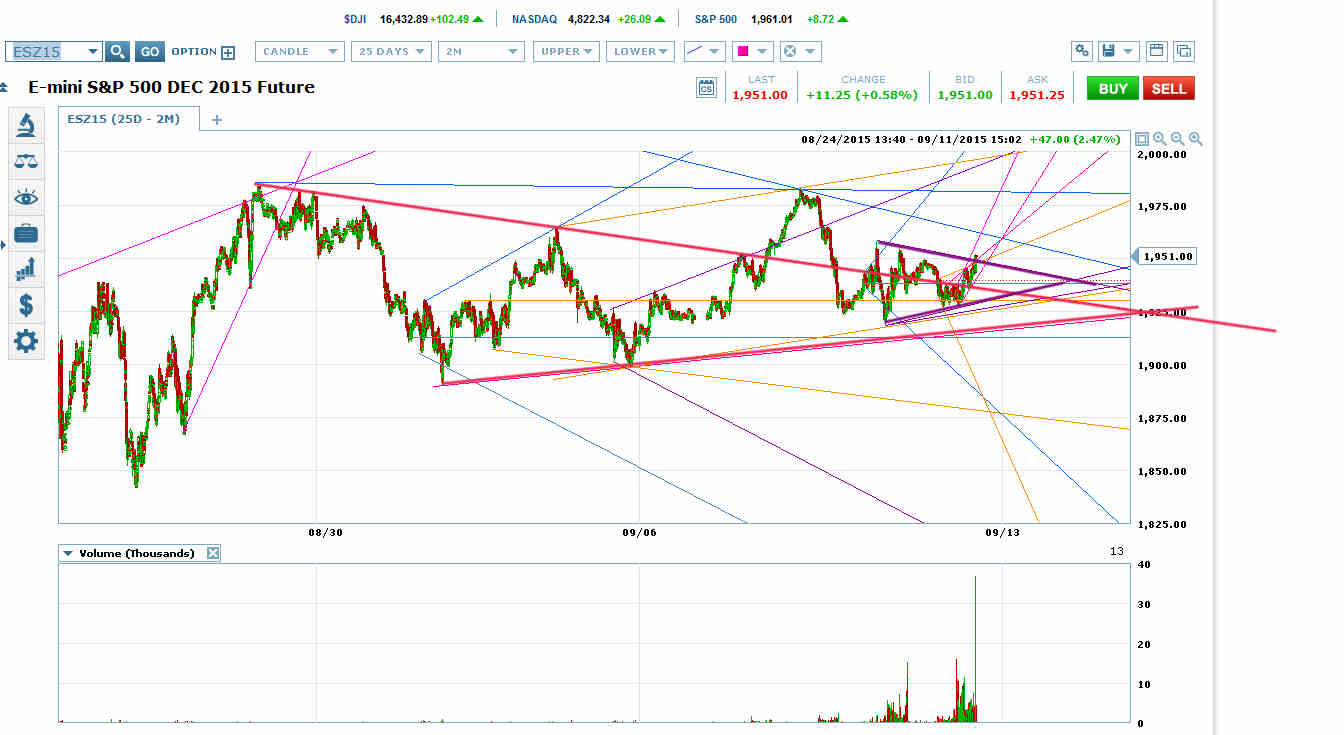
Now ES has broken out of the red triangle again and formed a replica “triangle” across its top (purple in chart below), triggering a short squeeze and a surge in SPY call volume on Friday.

ES Red Topping Triangle with Second Fake Breakout (Purple Triangle)
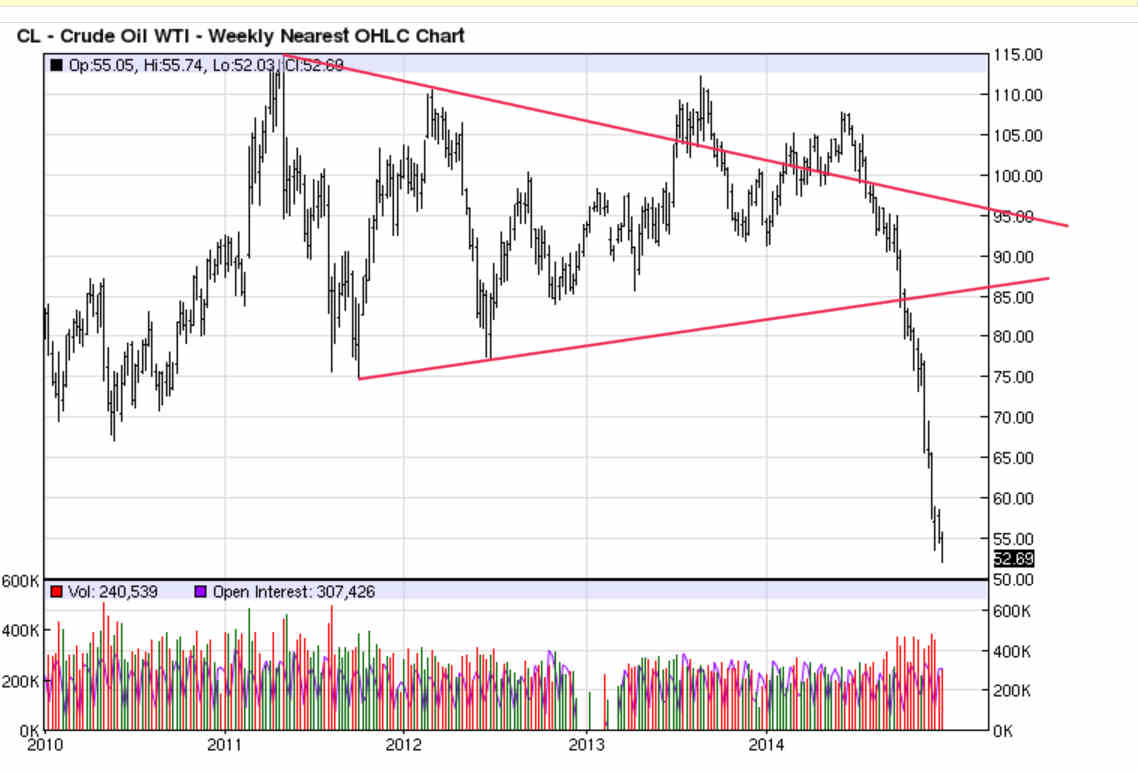
I thought it would be fun to show you a follow-up chart of oil so you could compare its subsequent price action. (The details are much clearer than on the chart of the continuous contract in the earlier post.)
December 2014 Oil Futures Chart
Note that oil completed a 2nd little H&S on its 2nd breakout from the red triangle and that was the end of the topping action before a downwards crash to the 2009 low.
Again, this is a classic type of topping action that you will see repeatedly, on many different trading instruments, on many different time frames.
ES could go straight into a downwards breakout from both its purple and red topping triangles. But it is more likely to morph the little purple topping triangle into a head and shoulders to match the oil topping formation.
The minimum target for this set-up, assuming we see the downwards breakout, would be the August 24 low. We’re likely to see a lower low, and there’s a great chance of seeing a much lower low.
Which stock should you buy in your very next trade?
With valuations skyrocketing in 2024, many investors are uneasy putting more money into stocks. Unsure where to invest next? Get access to our proven portfolios and discover high-potential opportunities.
In 2024 alone, ProPicks AI identified 2 stocks that surged over 150%, 4 additional stocks that leaped over 30%, and 3 more that climbed over 25%. That's an impressive track record.
With portfolios tailored for Dow stocks, S&P stocks, Tech stocks, and Mid Cap stocks, you can explore various wealth-building strategies.

