
Fear winning out over greed:
The market continues to hang on every hope of a settlement, with the dollar rising as various stories come out about possible ways a settlement might be reached, but subsequently falling back as the hopes are dashed. US stocks closed near their lows of the day and the VIX index closed at the highs, signifying that fear is dominating greed. At the end of the day there was no change in the Washington stand-off and little change in the dollar either, with the US currency opening in Europe more or less where it was Monday morning against most G10 currencies. The main exceptions were a further decline in USD/JPY in tandem with a decline in Tokyo equities and a stronger GBP as the RICS house price balance beat expectations and the British Chamber of Commerce said domestic and export demand strengthened in Q3. On the other hand, CAD weakened after building permits fell in August from a record high.
The news coming out of the US is uniformly depressing. Rather than finding possible solutions, most of the stories I read describe why many solutions that have been suggested are not really possible (such as President Obama unilaterally raising the debt ceiling, or the famous “$1tn platinum coin” idea) and why the Republicans have little incentive to compromise. Thus it seems more and more likely that this debacle will drag out. That’s likely to drag stocks down and damage those currencies that are most closely correlated with stocks: USD/CAD (-0.71), AUD/USD (0.67), NZD/USD (0.61). (Numbers in parenthesis are the weekly correlation between the currency pairs and S&P 500 index for the last three years.) JPY and CHF should be the likely beneficiaries, particularly JPY as CHF has the Swiss National Bank intervening to slow its ascension.
As the partial US government shutdown enters its 8th day US economic calendar is becoming thin with the release of most US economic indicators to be delayed. In Europe, German factory orders are expected to have risen by 1.1% mom in August, a turnaround from -2.7% mom in July. That could provide some support to EUR/USD. Germany’s trade surplus for August is expected to have fallen to EUR 15.0bn from EUR 16.1bn, but that indicator isn’t market moving. In Canada, housing starts are forecast to show a rise in September to 185.0K from a revised 180.2K, but that may not be enough of an increase to overcome the impact of yesterdays’ announcement of a steep fall in building permits in August. In the US, the NFIB small business optimism index for September is expected to remain unchanged at 94.0, if anyone is in fact watching US indicators nowadays. Overnight Bank of Japan will release the minutes from its monetary policy meeting of 4-5 Oct. Also, Bank of Japan Deputy Gov. Nakaso speaks at a meeting with business leaders. A press conference is scheduled after the meeting. Finally, we have three Fed and two ECB speakers on Tuesday. In Europe, ECB Governor Costa and ECB’s Weidmann will be speaking, while in the US, Dallas Fed President Fisher, Cleveland Fed President Pianalto and Philadelphia Fed President Plosser are speaking.
The Market
EUR/USDEUR/USD Hourly Chart" title="EUR/USD Hourly Chart" width="1730" height="812" src="https://d1-invdn-com.akamaized.net/content/pice8c03b338311f6cf20a5ff59d456b2d4.png" />
The EUR/USD moved slightly higher yesterday, but in early trading Tuesday morning in Europe, the pair moved slightly lower. Currently the rate is testing the 1.3564 (S1) support level, where a clear downward violation should confirm the momentum weakness, indicated by negative divergence between the oscillators and the price action. However, the 20-period moving average remains above the 200-moving average, thus, I would consider any downward wave as a correction of the 6th Sept. - 3rd Oct. upward move.
• Support: 1.3564 (S1), 1.3461 (S2), 1.3400 (S3)
• Resistance: 1.3644 (R1), 1.3706 (R2), 1.3800 (R3).
USD/JPYUSD/JPY Hourly Chart" title="USD/JPY Hourly Chart" width="1730" height="812" src="https://d1-invdn-com.akamaized.net/content/pic77de540e21db6e19f4baf7a5531ff634.png" />
The USD/JPY moved lower yesterday as the US government shutdown entered its second week, driving demand for JPY as a safe-haven. The pair broke below the critical level of 97.00 (yesterday’s support) and during early European trading the pair lies below it, heading towards 96.38 (S1). A clear downward penetration of the latter level could drive the battle towards the short term lows at 95.81 (S2). The rate is trading below both the moving averages, while both the RSI and MACD continue following their downward sloping path, confirming the validity of the downtrend.
• Support: 96.38 (S1), 95.81 (S2), 94.77 (S3).
• Resistance: 97.00 (R1), 97.86 (R2), 98.50 (R3).
EUR/GBPEUR/GBP Hourly Chart" title="EUR/GBP Hourly Chart" width="1730" height="812" src="https://d1-invdn-com.akamaized.net/content/pic0753a2b462a6f91d35c008596d59dc07.png" />
The EUR/GBP moved lower after hitting the upper boundary of the blue downward sloping channel. Currently the pair is lying slightly above the 0.8420 (S1) support. A decisive break below it would confirm my suspicions that the previous week’s rally was a correcting wave into the channel. I would start looking for trend reversal signals as soon as the upper boundary of the channel and the 0.8475 (R1) level are penetrated. The MACD oscillator lies in a bullish territory but crossed below its trigger line, confirming the lack of impetus for the pair to continue moving upwards.
• Support: 0.8420 (S1), 0.8388 (S2), 0.8332 (S3).
• Resistance: 0.8475 (R1), 0.8503 (R2) and 0.8552 (R3).
Gold
Gold moved higher, breaking the blue downtrend line and the resistance barrier of 1316 (today’s support). The aforementioned break confirmed our concerns in previous comments, as positive divergence between the oscillators and the price action did not give much room for the precious metal to continue its downward path. If the longs are strong enough to continue their momentum, they should target the 1343 (R1) resistance level and if they manage to win the battle at that level they will overcome the previous high and increase the probabilities for the establishment of a new uptrend.
• Support: 1316 (S1), 1291 (S2), 1273 (S3).
• Resistance: 1343 (R1), 1368 (R2), 1391 (R3).
Oil
WTI continued moving lower as fears over the Washington stalemate cast doubts about the strength of the recovery. Tomorrow’s Department of Energy crude oil inventory report is also expected to show a rise for the third consecutive week, further dampening sentiment in the market. WTI reached the well-tested level of 102.23 (S1) as expected and once more found support near that level and moved higher. However, I believe that the bears will not give up and they will attempt another test of that floor. The price remains in its downward sloping channel and alongside with the bearish cross of the moving averages, shifts the odds towards further downward movement.
• Support: 102.23 (S1), 101.02 (S2), 99.18 (S3).
BENCHMARK CURRENCY RATES - DAILY GAINERS AND LOSERS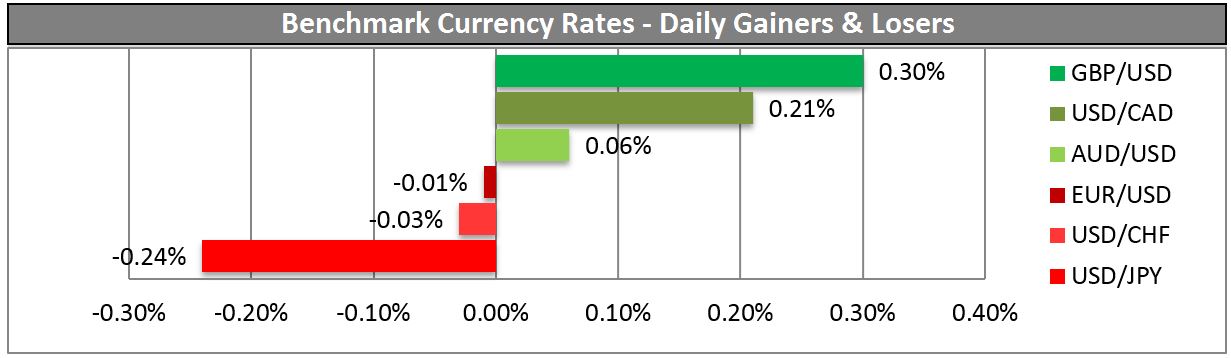
MARKETS SUMMARY: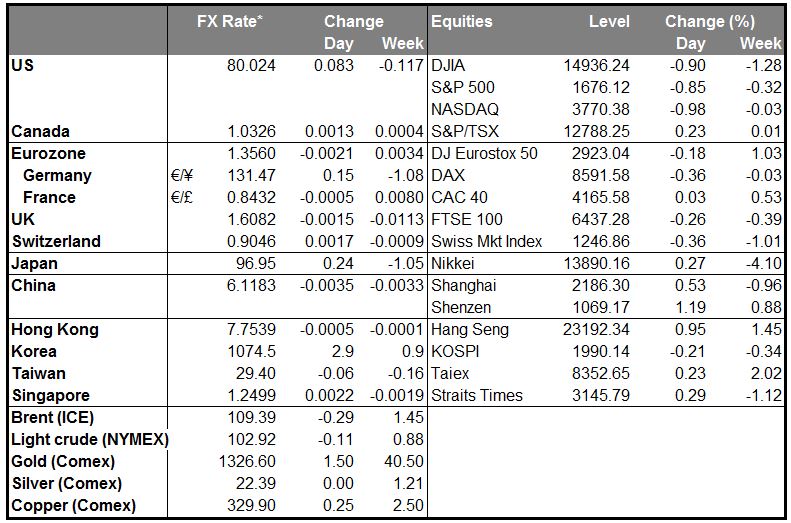
Which stock should you buy in your very next trade?
With valuations skyrocketing in 2024, many investors are uneasy putting more money into stocks. Unsure where to invest next? Get access to our proven portfolios and discover high-potential opportunities.
In 2024 alone, ProPicks AI identified 2 stocks that surged over 150%, 4 additional stocks that leaped over 30%, and 3 more that climbed over 25%. That's an impressive track record.
With portfolios tailored for Dow stocks, S&P stocks, Tech stocks, and Mid Cap stocks, you can explore various wealth-building strategies.