Cisco Systems (NASDAQ:CSCO) is slated to release corporate results for Q3 2018 today after the market close. Eight Zacks Investment Research analysts forecast that the networking and IT products giant will show EPS of $0.59 EPS up from the $0.54 EPS it posted for the same quarter last year.
For Cisco, 2017 was a good year. Even as growth stagnated, the company increased its value by more than 25%. Although growth this year declined to 20 percent, that's still significantly better than the NASDAQ Composite's relatively paltry 6.45 percent or even the NASDAQ 100's 7.75 percent gain YTD.
After the first revenue growth in the last quarter, should Cisco's revenue guidance of 3 percent YoY materialize, bringing that metric to just under $12 billion, it would break the company's revenue downtrend, seen over the last two years.
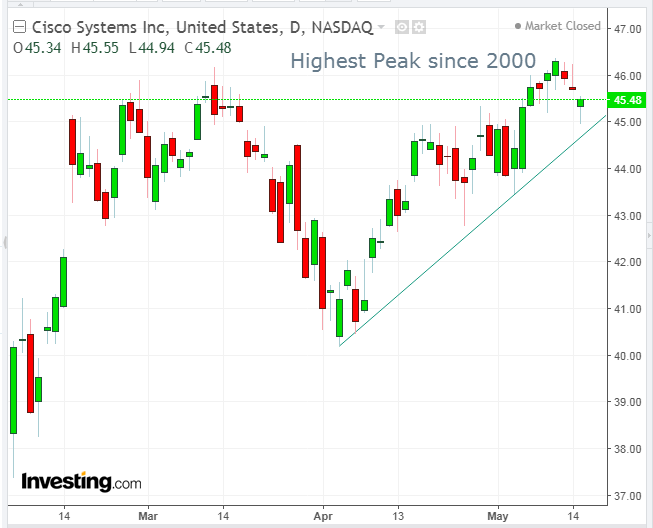
Stocks are an economic leading indicator. Cisco shares last week recorded their highest close since the 2000 tech bubble, $46.30—only 7 cents below the session high of $46.37, registered that same day.
Any stock that escaped the recent volatility unscathed demonstrates that its shareholders are loyal. It also indicates the stock could potentially withstand future swings in the future.
This is important. Future stock market volatility is likely as geopolitics take surprising turns and economic data signal conflicting messages about rates, against the backdrop of the highest US yields since 2011.
In the four sessions that followed Cisco's highest close since the 2000 tech bubble, the stock corrected 2.75 percent as of yesterday's intraday low. However, the price rebounded and closed only 2.00 percent lower than last week's record.
This higher close formed a Hammer, demonstrating that bulls had the last word. The proximity to the uptrend line since the beginning of April underscores the uptrend, suggesting an ideal entry for a long position, if traders can disregard the geopolitics and rising yields, as they mostly have done thus far. In any case, that's why equity management is key for consistent trading success.
Trading Strategies – Long Position Setup
Conservative traders may wait for a higher peak to confirm that prices may continue to rise despite geopolitics and the sudden renewed of 3 more rate hikes this year.
Moderate traders would be satisfied with a higher close than yesterday.
Aggressive traders may enter now, providing they can afford a stop loss below the uptrend line at $44.7 per the current angle or the presumed support at the $44.00 congestion; alternatively, they may wait for a buying dip toward these levels.
Equity Management
Traders are advised against entering trades with less than a 1:3 risk-reward ratio. To achieve this, work out your risk, based on the stop-loss and potential reward, based on your target relative to your entry price.
Example
- Entry: $45.00
- Stop-loss: $44.50
- Risk: $0.50 (target must be at least $1.50 to achieve 1:3 RRR)
- Target: $46.50
- Reward: $1.50
- Risk-Reward Ratio: 1:3
Which stock should you buy in your very next trade?
AI computing powers are changing the stock market. Investing.com's ProPicks AI includes 6 winning stock portfolios chosen by our advanced AI. In 2024 alone, ProPicks AI identified 2 stocks that surged over 150%, 4 additional stocks that leaped over 30%, and 3 more that climbed over 25%. Which stock will be the next to soar?
Unlock ProPicks AI
