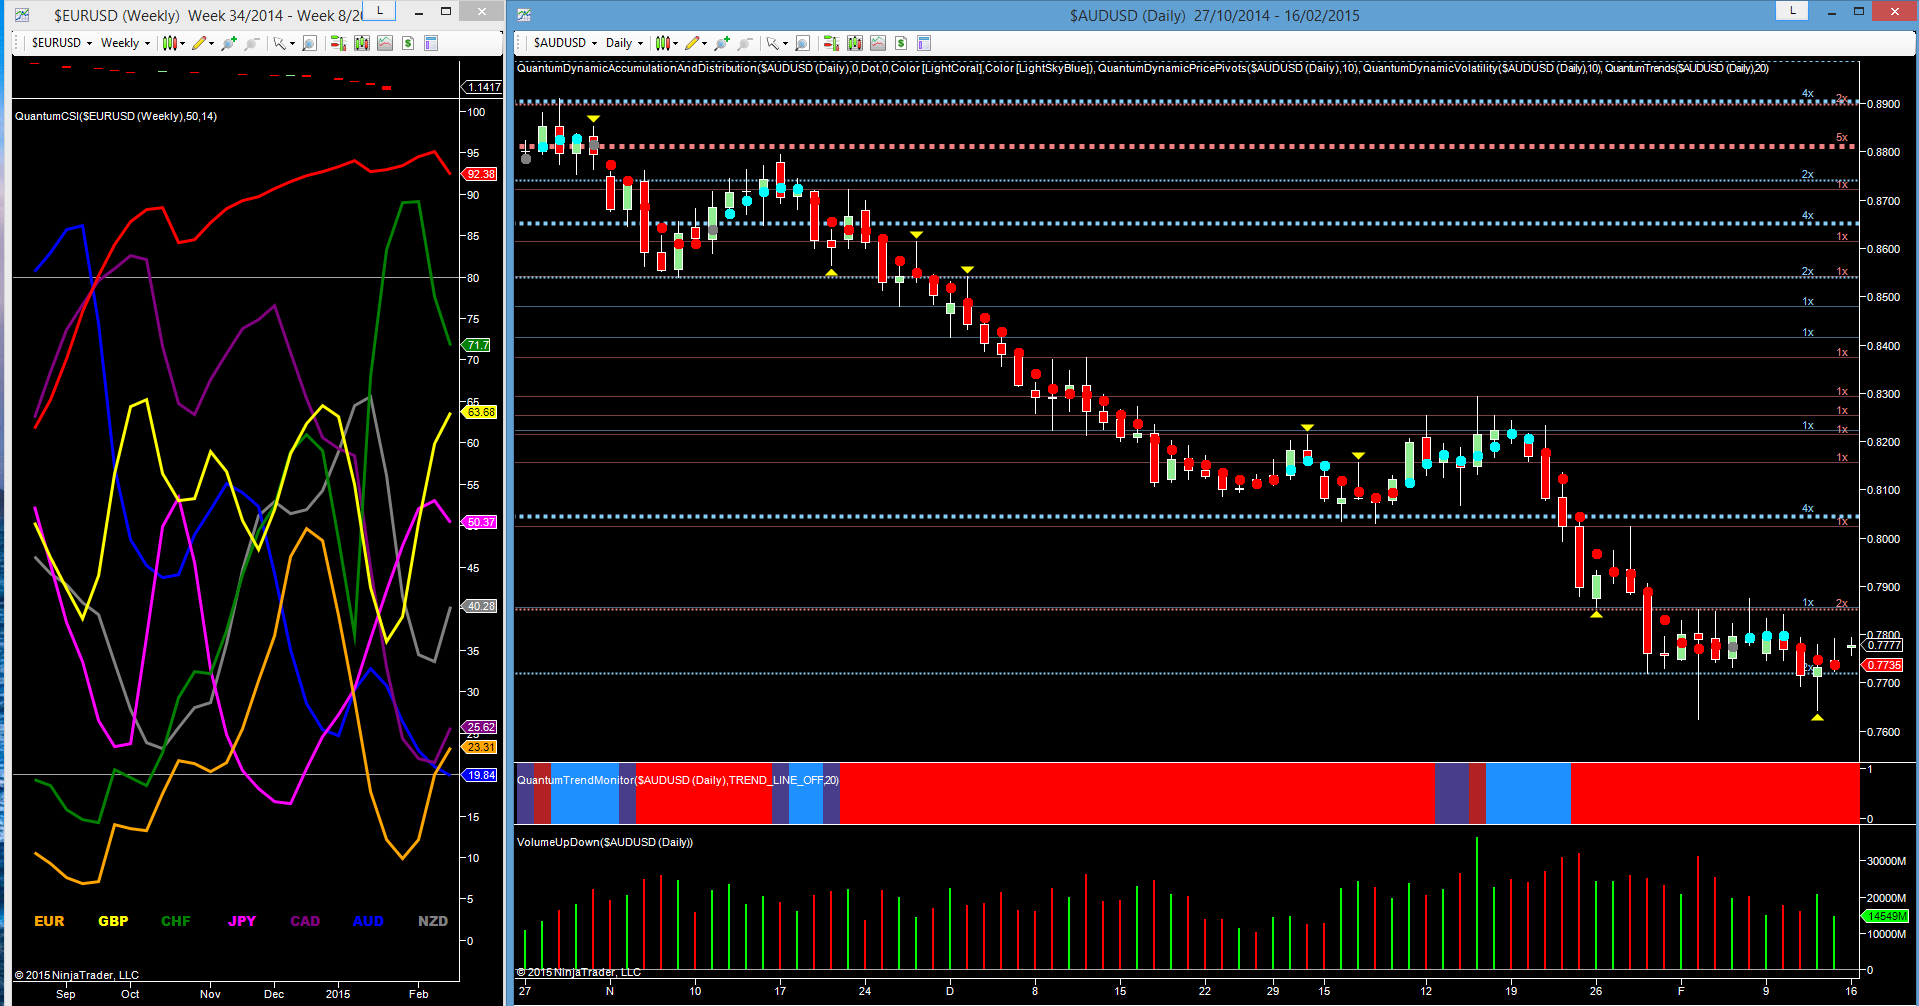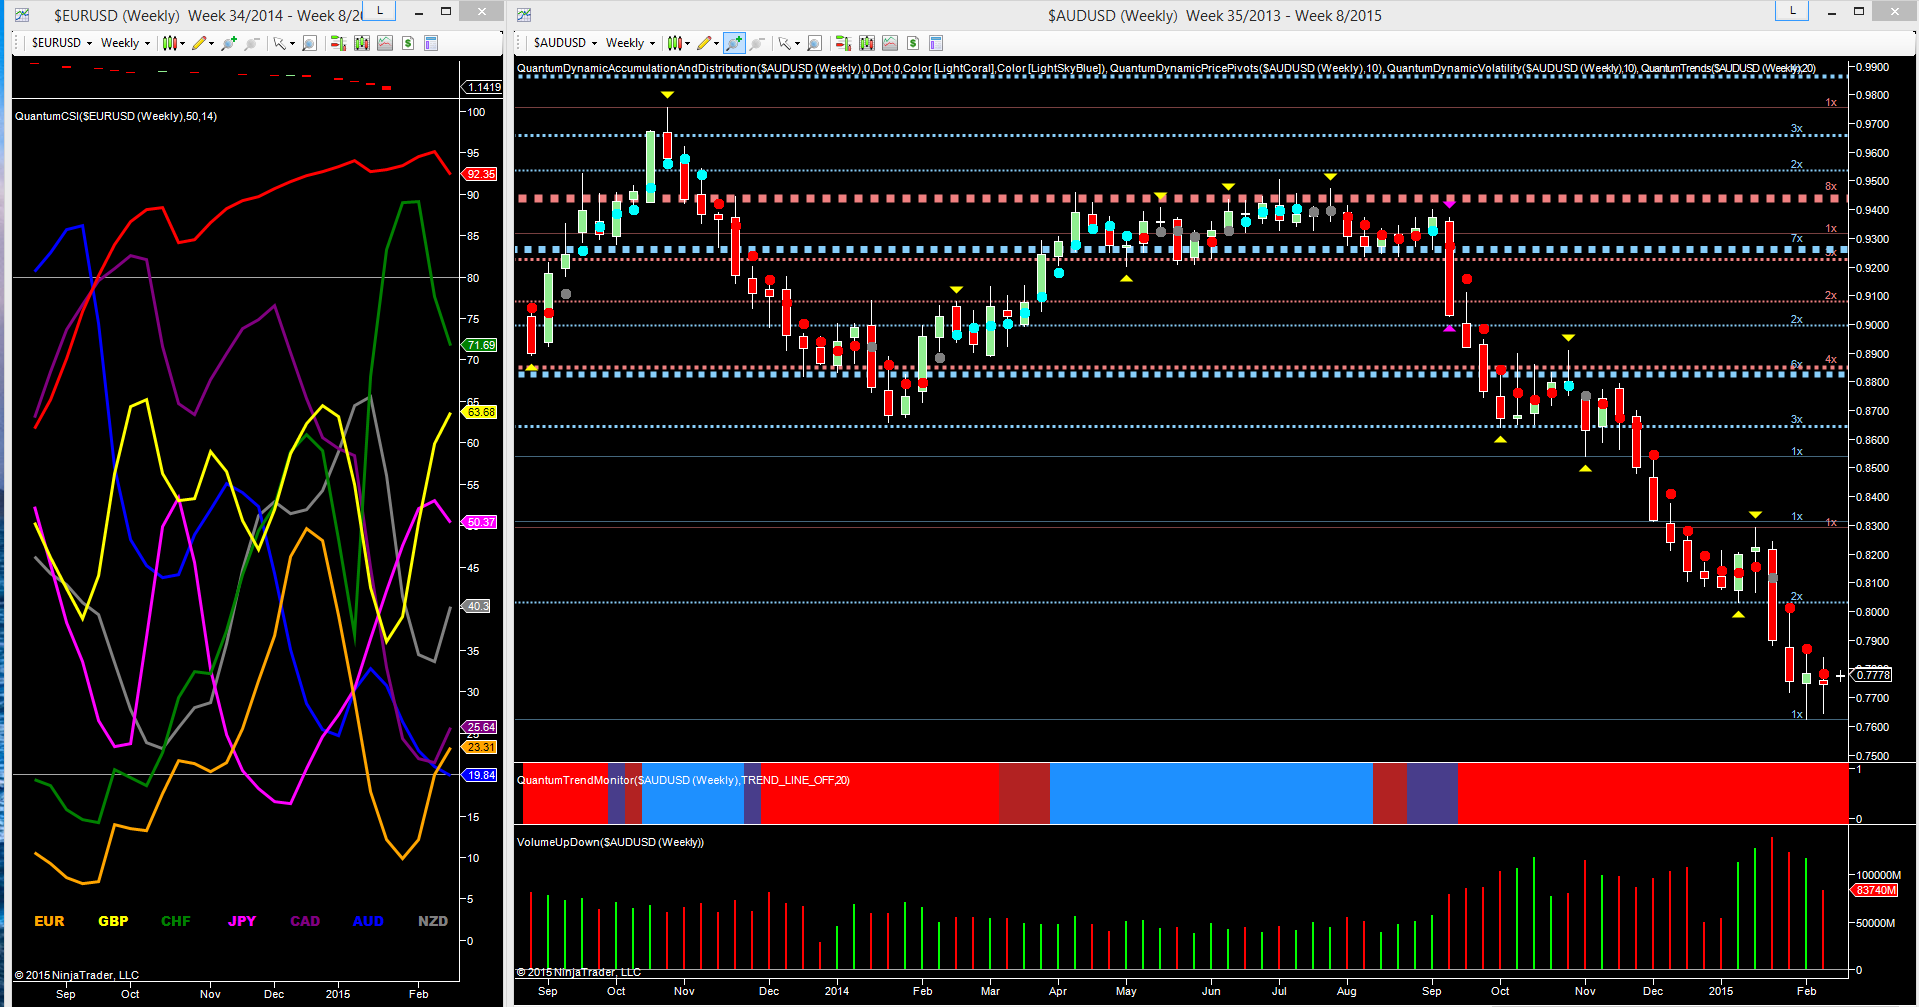
For the AUD/USD, along with many of the other currency majors, February has been characterized as a pause period on the longer term charts, as the US dollar Index finally reaches an exhaustion point following the dramatic gains of the last few months. And for context and analysis, I have the weekly currency strength indicator, but matched to the daily chart of the AUD/USD in order to take a multi time frame approach.
If we start with the currency strength indicator to the left of the chart, here we can see the current price action clearly in evidence, with the US dollar, the red line, having reached a heavily overbought position at the top and now preparing to reverse from this region and move lower in the longer term.
For the Aussie dollar, the blue line, this is now moving into the heavily oversold region on the indicator. So with both currencies at extremes we have a clear signal of a possible reversal in sentiment for the pair. However, it is important we remember that currencies can remain overbought or oversold for extended periods, and for any longer term positions to develop we have to be patient and wait for the price action to unfold, with an analysis of volume and price, candles and candle patterns confirming the picture. It is also important to note the Aussie dollar still has some way to go before reaching a heavily oversold position, so a signal in itself perhaps!
Moving to the daily chart, the pause point here is self evident with the pair moving into a congestion phase, with the floor defined by the blue dotted line in the 0.7710 region and the ceiling by the double dotted line at 0.7850. If we begin with the price action, what is perhaps evident is the number of failed attempts to rally, with each candle having a deep upper wick and confirming the bearish nature for the pair at present.
This characteristic has been evident for much of February, and only counterbalanced by the two deep moves to the downside on the 3rd and the 12th of February respectively. On the first of these we should have expected to see significantly higher volume if this was indeed stopping volume, rather than the average to high volume which was duly delivered. The volume on Thursday’s repeat candle last week was equally modest with Friday’s effort to rally, once again stalling.
Against the price chart we also have to consider the fundamental picture, and here it is a question of who is likely to dominate. Will it be the US dollar and the FOMC cooling their tone, or will it be the RBA whose declared intent is to see a weak currency. My own view is that the RBA will continue to remain dominant, and as such we are likely to see some further downside momentum for the AUD/USD, with the current price action merely a pause point in the longer term bearish trend and similar to that seen towards the end of 2014, with the next leg down then developing in early 2015.
This also reflects the picture on the currency strength indicator with the AUD moving deeper into the oversold region. The key level. on the daily chart is now in the 0.7700 area, and any close below this level will then open the way for a further move lower.

Finally rounding off with the weekly chart, here we can see the two long legged doji candles which define the current pause point for the pair, but again the volumes here do not suggest any major buying at this level, and until we see such a buying climax in the longer term time frames (and there is no sign just yet), then the pair is likely to remain bearish for the time being.
Which stock should you buy in your very next trade?
With valuations skyrocketing in 2024, many investors are uneasy putting more money into stocks. Unsure where to invest next? Get access to our proven portfolios and discover high-potential opportunities.
In 2024 alone, ProPicks AI identified 2 stocks that surged over 150%, 4 additional stocks that leaped over 30%, and 3 more that climbed over 25%. That's an impressive track record.
With portfolios tailored for Dow stocks, S&P stocks, Tech stocks, and Mid Cap stocks, you can explore various wealth-building strategies.
