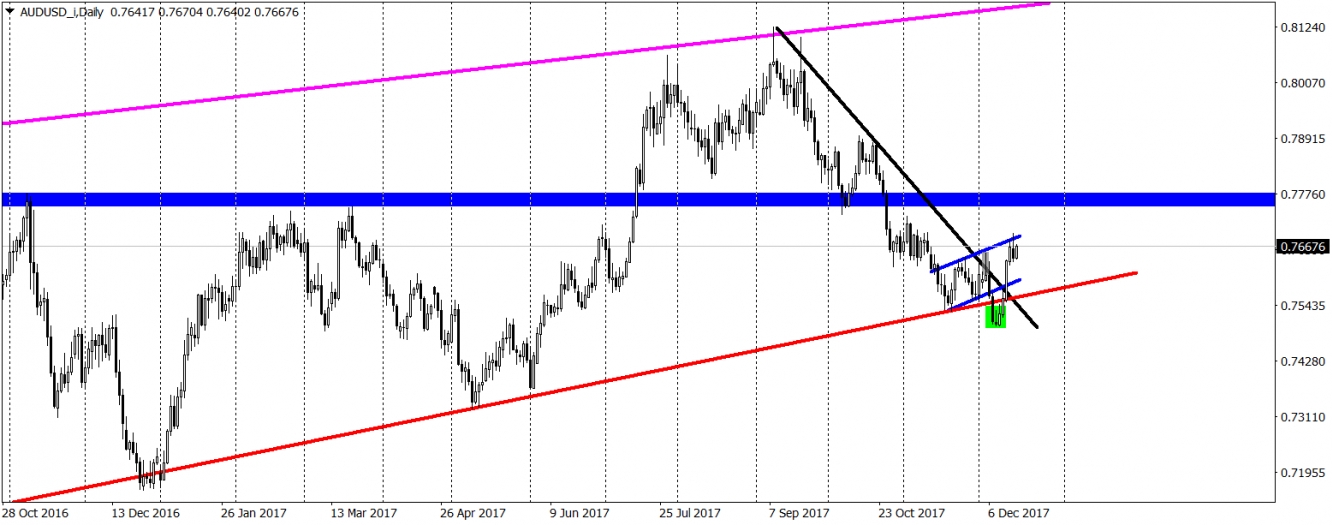
Since the beginning of September, AUDUSD is in a strong downtrend. After making the new yearly highs, the price created a head and shoulders pattern which technically triggered a sell signal. AUDUSD was nicely going down, the price was making lower lows and lower highs and on the 7th of December, we broke the long-term up trendline (red). In theory, that was a major sell signal. Just in theory though. After few days we can see that bullish movement is more probable here.
What happened? Not much, that is a typical false breakout pattern (green) here. After breaking the lower line of the flag (blue) and the trendline, the price did not continue to go down, leaving all new sellers with losses. The price reversed sharply, broke all new resistances (created from the previous supports) and broke the mid-term down trendline (black). Last week was pretty successful here, AUDUSD edged higher, maybe apart from the Friday when the price created a shooting star candlestick. We should not put too much attention into that candle though. Today, the optimism is continued and traders are not following this sentiment from the bearish Friday.
As for the closest target, in our opinion it is the 0.776 (blue) so a resistance from the November 2016 and March this year. Our positive outlook for the Aussie will be denied once the price will break the red line again, which for now is less likely to happen.
3rd party Ad. Not an offer or recommendation by Investing.com. See disclosure here or remove ads.

Which stock should you buy in your very next trade?
AI computing powers are changing the stock market. Investing.com's ProPicks AI includes 6 winning stock portfolios chosen by our advanced AI. In 2024 alone, ProPicks AI identified 2 stocks that surged over 150%, 4 additional stocks that leaped over 30%, and 3 more that climbed over 25%. Which stock will be the next to soar?
Unlock ProPicks AI