
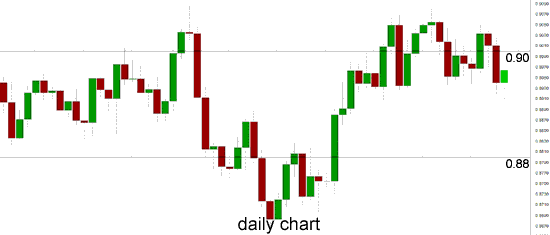
Throughout the last few weeks the Australian dollar has done very little other than continue to trade around the 0.90 level. In the last few days it has fallen down sharply below this level to a support level around 0.8950 where it is presently consolidating. Earlier this month the Australian dollar enjoyed a strong move higher moving through the previous resistance level at 0.88 and reaching a three week high around 0.8980. For a couple of weeks the Australian dollar continued to make runs at the resistance level of 0.88 only to be rejected again and again and forced lower. During this time the Australian dollar seemed content to remain steady and consolidate just below the key 0.88 level, after its strong fall through most of January. For the last few months the Australian dollar has established and traded within a narrow range roughly between 0.88 and the previous resistance level at 0.90.
Back in January the Australian dollar was able to rally higher pushing through the resistance at 0.90 to a one month high near 0.91, however it has since returned to more familiar territory below the resistance levels at 0.90 and 0.88. After showing some resilience in early December moving to a one week high above 0.9150, the AUD/USD spent the next two weeks turning around sharply and falling heavily down to a then three month low close to 0.88.
After all of its steady good work in the middle of November which saw the AUD/USD steadily move higher from support at 0.93 back up to a one week high near 0.9450, the AUD/USD has since returned all of those gains and then some more. Throughout most of October the AUD/USD enjoyed a solid and steady move higher from the support level at 0.93 up to the resistance level at 0.95 and beyond to a high around 0.9760. It has been all down hill since then. Throughout the first half of September the AUD/USD enjoyed a solid run which was punctuated by a strong surge higher sending it to a then three month high just above 0.95. A couple of months ago the AUD/USD had been trying valiantly to stay above the support level at 0.89 as all week it placed downward pressure but was unable to sustain any break lower.
Australian releases continue to disappoint this week. Private Capital Expenditure fell by 5.2%, its sharpest drop since April 2009. The reading was much worse than expected, with the estimate standing at -1.0%. This dismal figure comes on the heels of Construction Work Done, which dropped by 1.0%, its fourth decline in five months. The Aussie has responded with further losses, and has given up about a cent since Tuesday.
 AUD/USD Daily Chart" title="AUD/USD Daily Chart" width="474" height="235">
 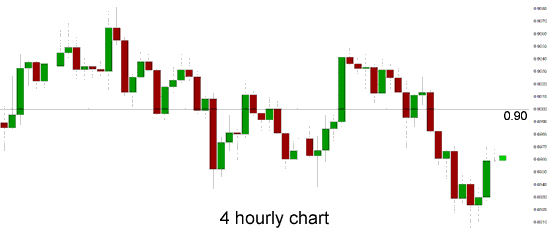 AUD/USD 4 Hourly Chart" title="AUD/USD 4 Hourly Chart" width="474" height="229">
AUD/USD February 27 at 21:50 GMT 0.8965 H: 0.8969 L: 0.8904
AUD/USD Technical
| S3 | S2 | S1 | R1 | R2 | R3 |
| 0.8950 | --- | --- | 0.9050 | 0.9080 | 0.9180 |
During the early hours of the Asian trading session on Friday, the AUD/USD is consolidating a little around 0.8960 after dropping sharply back below the key 0.90 level over the last couple of days. The Australian dollar was in a free-fall for a lot of last year falling close to 20 cents. Current range: trading just below 0.9000 around 0.8960.
Further levels in both directions:
• Below: 0.8950.
• Above: 0.9050, 0.9080 and 0.9180.
OANDA’s Open Position Ratios
![]()
(Shows the ratio of long vs. short positions held for the AUD/USD among all OANDA clients. The left percentage (blue) shows long positions; the right percentage (orange) shows short positions.)
The long position ratio for the AUD/USD has moved back above 60% as the Australian dollar has dropped back below 0.90. The trader sentiment remains in favour of long positions.
Economic Releases
- 23:30 (Thu) JP CPI Core (Nation) (Jan)
- 23:30 (Thu) JP CPI Core (Tokyo) (Feb)
- 23:30 (Thu) JP Unemployment (Jan)
- 23:50 (Thu) JP Retail Sales (Jan)
- 00:05 UK GfK Consumer Confidence (Feb)
- 00:30 AU Private Sector Credit (Jan)
- 05:00 JP Construction orders (Jan)
- 05:00 JP Housing starts (Jan)
- 10:00 EU HICP (Flash) (Feb)
- 10:00 EU Unemployment (Jan)
- 13:30 CA GDP (Dec)
- 13:30 US Core PCE Price Index (2nd Est.) (Q4)
- 13:30 US GDP Annualised (2nd Est.) (Q4)
- 13:30 US GDP Price Index (2nd Est.) (Q4)
- 14:45 US Chicago PMI (Feb)
- 14:55 US Univ of Mich Sent. (Final.) (Feb)
- 15:00 US Pending Home Sales (Jan)
Which stock should you buy in your very next trade?
AI computing powers are changing the stock market. Investing.com's ProPicks AI includes 6 winning stock portfolios chosen by our advanced AI. In 2024 alone, ProPicks AI identified 2 stocks that surged over 150%, 4 additional stocks that leaped over 30%, and 3 more that climbed over 25%. Which stock will be the next to soar?
Unlock ProPicks AI