STOXX Europe 600: UBS weighs in as index hits its 2025 price target
Markets have been a bit slow getting out of the blocks this morning as Europe’s daylight savings time shift and a lack of top-tier economic data has prompted many traders to punch the snooze button. Probably the biggest development over the weekend was the long-anticipated release of the European bank stress tests, which showed that most of Europe’s largest banks are on generally stable footing. However, the subsequent release of yet another disappointing German IFO report (103.2 vs. 104.6 expected) has kept EUR/USD below the 1.2700 handle heading into today’s US session.
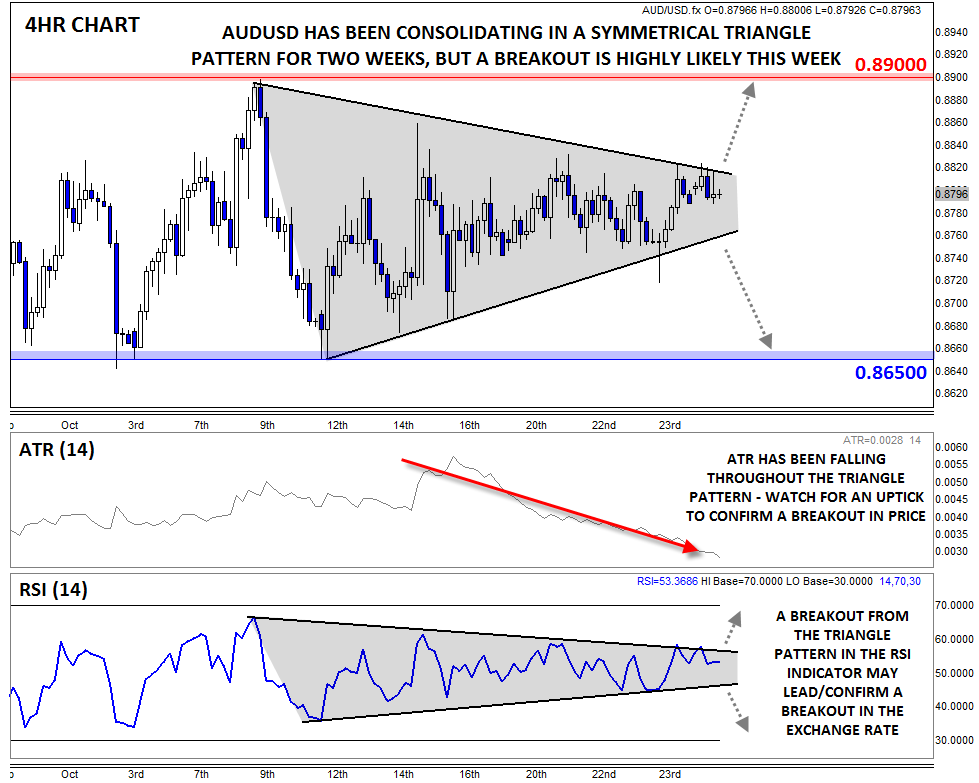
Though markets are off to a slow start, volatility should start to pick up as the week progresses. In that vein, one pair primed for a breakout is AUD/USD. For the last two weeks, the Aussie has been putting in lower highs and higher lows against the greenback, creating a clear symmetrical triangle pattern. For the uninitiated, this pattern is analogous to a person compressing a coiled spring: as the range continues to contract, energy builds up within the spring. When one of the pressure points is eventually removed, the spring will explode in that direction. Similarly, if and when AUD/USD breaks out from its triangle, a strong continuation in the same direction is likely.
The textbook symmetrical triangle pattern will see declining volume as the pattern develops and then a surge in volume once the instrument breaks out. Of course, it’s difficult to find a reliable measure of volume in the forex market, but a good proxy for trading interest in a currency pair is the Average True Range (ATR). As the chart below shows, the ATR(14) indicator has been dropping consistently, falling from nearly 60 pips per 4hr candle two weeks ago to under 30 pips per candle today. This confirms that traders are growing increasingly disinterested in the pair, a common precursor to a big breakout; readers should keep their eyes out for an uptick in the ATR indicator to confirm any breakout in price.
Finally, the RSI pattern is forming its own corresponding symmetrical triangle pattern. As many experienced traders know, a breakout in a corresponding indicator pattern can serve as a leading or confirming indicator for a breakout in the exchange rate itself.
Bringing it all together, AUD/USD is displaying a picture-perfect symmetrical triangle pattern. With the triangle pattern nearing its apex, a breakout and continuation is highly likely this week. A confirmed break to the topside could quickly expose the October high at .8900, while a drop through the bottom of the pattern would favor a move toward the 4-year low at .8650 next. Keep an eye on tomorrow’s US Durable Goods and Consumer Confidence reports, Wednesday’s Fed Meeting, or Thursday’s US GDP report as possible catalysts for a breakout in AUD/USD.

Which stock should you buy in your very next trade?
With valuations skyrocketing in 2024, many investors are uneasy putting more money into stocks. Unsure where to invest next? Get access to our proven portfolios and discover high-potential opportunities.
In 2024 alone, ProPicks AI identified 2 stocks that surged over 150%, 4 additional stocks that leaped over 30%, and 3 more that climbed over 25%. That's an impressive track record.
With portfolios tailored for Dow stocks, S&P stocks, Tech stocks, and Mid Cap stocks, you can explore various wealth-building strategies.
