Trump says he will sue Wall Street Journal, NewsCorp, over Epstein letter report
Curve Watchers Anonymous is taking a hard look at the yield curve in light of the now odds-on market view of a March rate hike.
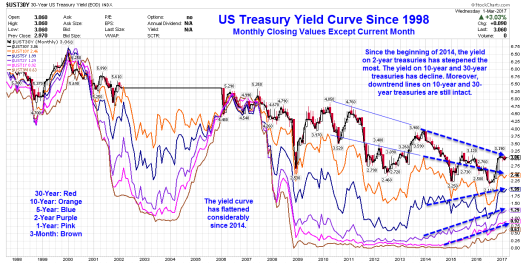
Before looking at the chart below, where do you think rates are relative to January 2014? Up, down, or sideways?
Yield Curve Since 1998

The chart shows monthly closing values except for the current month.
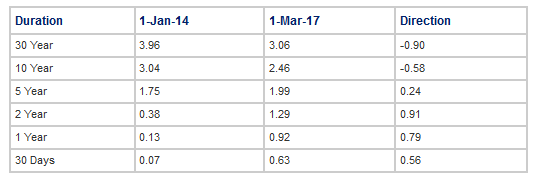
Change Since January 2014

The 2-30 spread flattened by a whopping 181 basis points in just over two years.
The 2-10 spread flattened by 149 basis points.
A flattening of the yield curve is not good for bank profits. Rising 10-year yields since mid-2016 are not good for mortgages or housing affordability.
Not to worry, despite poor economic reports, Fed governors have stated: “This is a surprisingly strong economy.”
Surprisingly Strong Economy Links
- March Rate Hike Odds Surge to 80 Percent: New Standard for “Surprisingly Strong” Economy
- Inflation-Adjusted Spending Declines Most Since September 2009: Stagflation Coming?
- Construction Spending Unexpectedly Declines One Percent
- New Home Sales Rise Half of Economists’ Expectations, Supply Surges
- 4th Quarter GDP Unexpectedly Undershoots Consensus: What’s Ahead?
- Trade Deficit Unexpectedly Widens: Exports Sink, Imports Up Sharply
- GDPNow 1st Quarter Forecast Plunges to 1.8% Following Personal Income and Outlays Report
Somewhere in that set of links, there is hidden “surprising strength”. I leave it to the reader to find the surprises and report back.
Which stock should you buy in your very next trade?
AI computing powers are changing the stock market. Investing.com's ProPicks AI includes 6 winning stock portfolios chosen by our advanced AI. In 2024 alone, ProPicks AI identified 2 stocks that surged over 150%, 4 additional stocks that leaped over 30%, and 3 more that climbed over 25%. Which stock will be the next to soar?
Unlock ProPicks AI