😎 Watchlist Weekend: Copy legendary investors' portfolios to your watchlist in 1 clickCopy for FREE

WTI On Correction Pattern

Published 10/15/2017, 09:57 AM

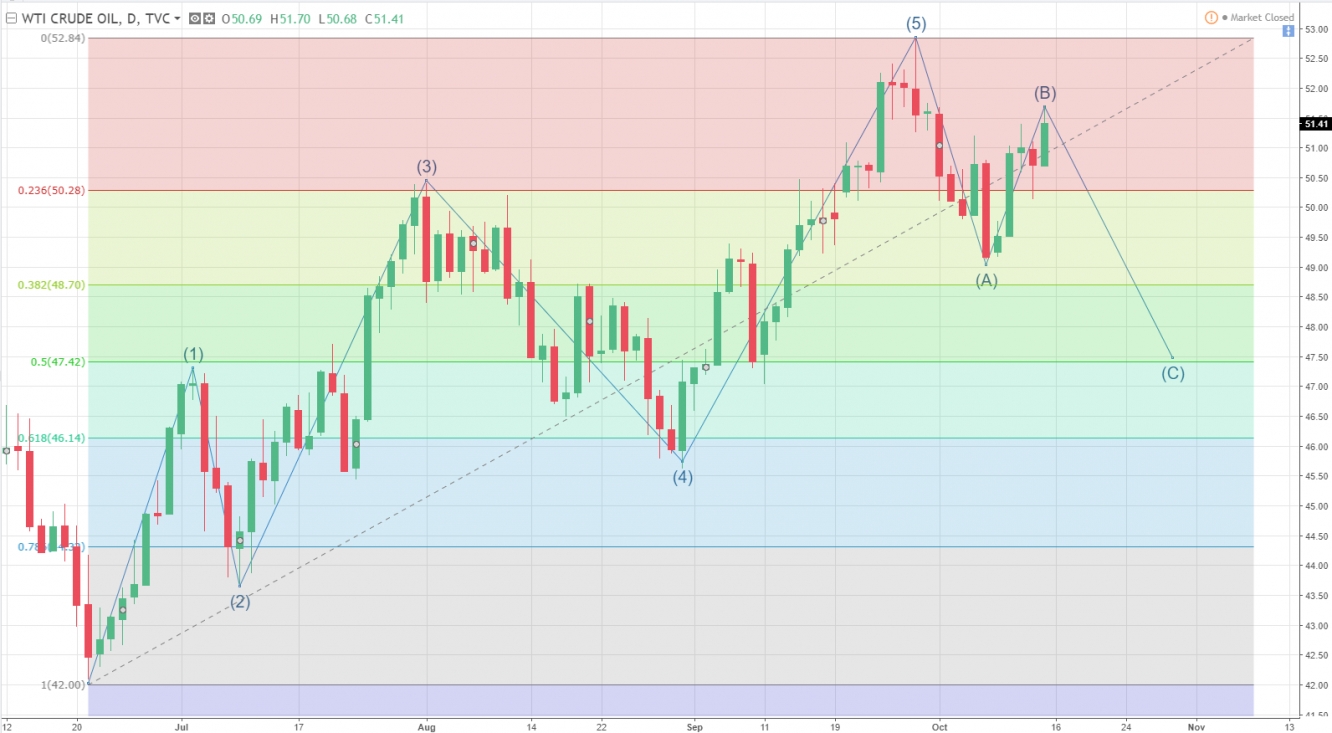
On a daily chart WTI has performed under an Elliot Wave Pattern since July. It's final trend wave ended on late September with help of OPEP statement of commitment to current output and Turkey's threat to cut oil production.

Since then bears have taken control in Oil industry. Wave A managed to touch Fibbonaci 38% level before entering wave B. Although we can't confirm at this stage final price of Wave B since it needs to show some red candles. As for now prices can still go further up and break $53 level.

However if this doesn't occur this week. Prices are projected in a downtrend forming Wave C. Most optimistic scenario would be Fibonacci 50% at $47.50.


WTI Daily Chart

3rd party Ad. Not an offer or recommendation by Investing.com. See disclosure here or remove ads.

Which stock should you buy in your very next trade?

AI computing powers are changing the stock market. Investing.com's ProPicks AI includes 6 winning stock portfolios chosen by our advanced AI. In 2024 alone, ProPicks AI identified 2 stocks that surged over 150%, 4 additional stocks that leaped over 30%, and 3 more that climbed over 25%. Which stock will be the next to soar?

Unlock ProPicks AI
Latest comments

Loading next article…
Risk Disclosure: Trading in financial instruments and/or cryptocurrencies involves high risks including the risk of losing some, or all, of your investment amount, and may not be suitable for all investors. Prices of cryptocurrencies are extremely volatile and may be affected by external factors such as financial, regulatory or political events. Trading on margin increases the financial risks.
Before deciding to trade in financial instrument or cryptocurrencies you should be fully informed of the risks and costs associated with trading the financial markets, carefully consider your investment objectives, level of experience, and risk appetite, and seek professional advice where needed.
Fusion Media would like to remind you that the data contained in this website is not necessarily real-time nor accurate. The data and prices on the website are not necessarily provided by any market or exchange, but may be provided by market makers, and so prices may not be accurate and may differ from the actual price at any given market, meaning prices are indicative and not appropriate for trading purposes. Fusion Media and any provider of the data contained in this website will not accept liability for any loss or damage as a result of your trading, or your reliance on the information contained within this website.
It is prohibited to use, store, reproduce, display, modify, transmit or distribute the data contained in this website without the explicit prior written permission of Fusion Media and/or the data provider. All intellectual property rights are reserved by the providers and/or the exchange providing the data contained in this website.
Fusion Media may be compensated by the advertisers that appear on the website, based on your interaction with the advertisements or advertisers.
© 2007-2025 - Fusion Media Limited. All Rights Reserved.