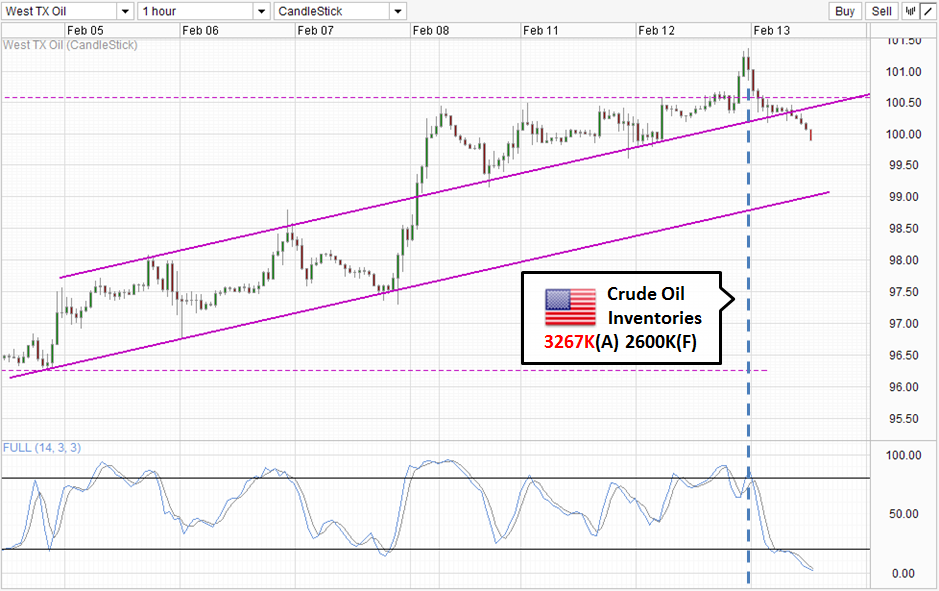
Has sense gotten back into the market? After days of rallying with little fundamental support, prices have since climbed down from the 4 month high to sub 100.0 levels. This decline also came in rather timely as it stopped short of a bullish breakout that was just starting with the breach of 100.57 resistance. As the start of the decline matched with the release of DOE data, it is reasonable to believe that the surprisingly bearish numbers was the main catalyst for the decline even though overall sentiment in WTI has been broadly bullish, and perhaps even to the point of irrationality.
Therefore, it is good to see market paying attention to fundamental drivers, as that would make price direction just a bit more predictable, and in this regard bulls will certainly be upset as it appears that sentiment/trend is turning bearish.
Hourly Chart
 Price has fallen below the 100.57 level, hence invalidating the "breakout", but more importantly we are seeing price trading below the rising Channel Top, which opens up a move towards Channel Bottom which will most likely be the confluence with the swing low of Monday if we tag Channel Bottom during late Europe or early US session.
Given that Stochastic readings are at the most Oversold levels as far as hourly chart historical data can go (13th December) , the likelihood of Channel Bottom holding up increases. But this would also present to us a perfect opportunity for bears to show what they are made of. If Channel Bottom is broken conclusively, the bullish sentiment that has sent prices much higher in the past 2 weeks will be fully invalidated and we could see further selling taking place as market unwind the "ill gotten" gains that has been accumulating when fundamentals clearly do not support
Daily Chart
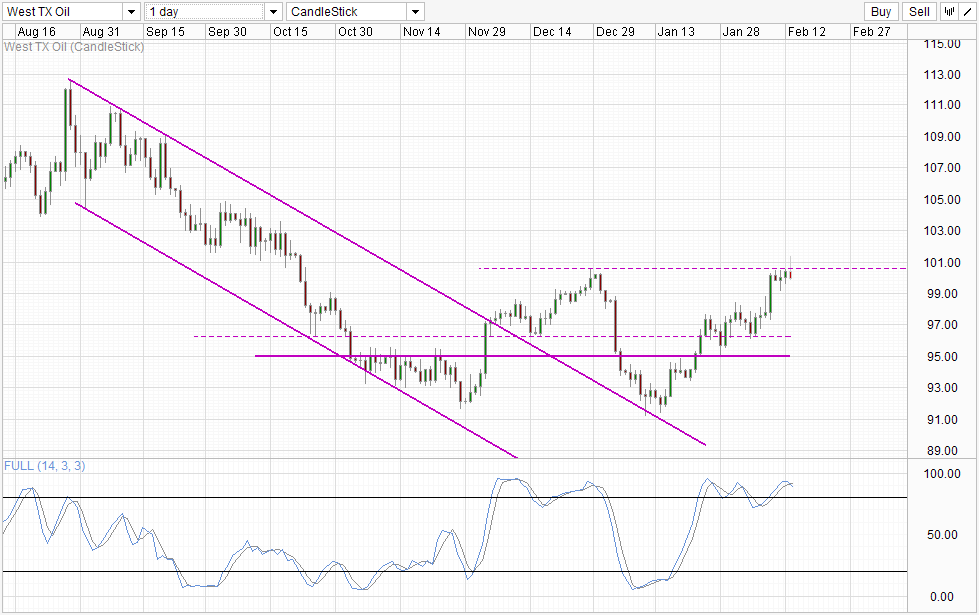
The break down of bullish sentiment will go a long way for Daily Chart, which is hinting of a long-term reversal towards 91.2 swing low which was made on 10th Jan. Stochastic readings agree as well, as Stoch curve has just crossed Signal line within the Overbought region, and should a proper bearish cycle signal is formed (stoch levels below 80.0) in conjunction with price breaking the soft support 99.0, the likelihood of a full bearish reversal and a continuation of the long-term downtrend increases.
Which stock should you buy in your very next trade?
AI computing powers are changing the stock market. Investing.com's ProPicks AI includes 6 winning stock portfolios chosen by our advanced AI. In 2024 alone, ProPicks AI identified 2 stocks that surged over 150%, 4 additional stocks that leaped over 30%, and 3 more that climbed over 25%. Which stock will be the next to soar?
Unlock ProPicks AI
