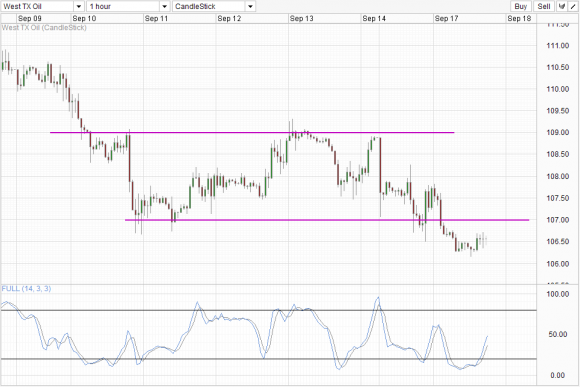
Hourly Chart
Crude Oil continued yesterday's downtrend after yet more QE Taper fears emerged during Monday’s US session. Prices managed to break the 107.0 support, but the bearish impetus wasn’t continued during the Asian session, with prices actually trading slightly higher during early European trade. However, bulls hopping for a stronger correction towards 107.0 may be disappointed, as prices do not seem to be able to break above the soft 106.7 level.
Therefore, do not be surprised to see prices heading lower from here before 107.0 is properly tested. Stochastic readings--which are still pointing strongly higher--may also be able to turn sharply lower since the latest peak has been lower than the one seen on Monday’s opening gap.
Nonetheless, the prudent trader may want to wait for further confirmation as there is no evidence that a bearish move is happening right now. Bears should preferably trade below today’s swing low of 106.15 which will likely coincide with a Stoch curve reversal for a stronger bearish conviction. This may lead us closer towards 103.0, but it is reasonable to think that prices will most likely experience another, stronger bullish pullback en route. Consider that there isn’t much space for a continuous bearish cycle based on current stoch levels.
Wednesday’s FOMC monetary policy announcement may throw yet another spanner in the works. Considering that Crude Oil has been bearish even when risk appetite is strong, an evaporation of risk appetite should the Fed announce a tapering move will most likely send Crude down even further.
Even if the Fed doesn’t announce a tapering measure this time around, any pop higher may be only temporary, and that will be an even more damning bearish verdict for price outlook, similar to what's happening with Gold. This pullback will provide good recovery space to prevent any sharp bullish retracement due to the over-extension from bears and at the same time present better prices for current underlying bears to short into.
As such, the subsequent bearish thrust may be stronger and longer lasting as compared to a direct move to 103.0 from here, with the latter having a higher chance to break the 103.0 mark and send price back below the 100.0 region.
Original post
Which stock should you buy in your very next trade?
AI computing powers are changing the stock market. Investing.com's ProPicks AI includes 6 winning stock portfolios chosen by our advanced AI. In 2024 alone, ProPicks AI identified 2 stocks that surged over 150%, 4 additional stocks that leaped over 30%, and 3 more that climbed over 25%. Which stock will be the next to soar?
Unlock ProPicks AI
