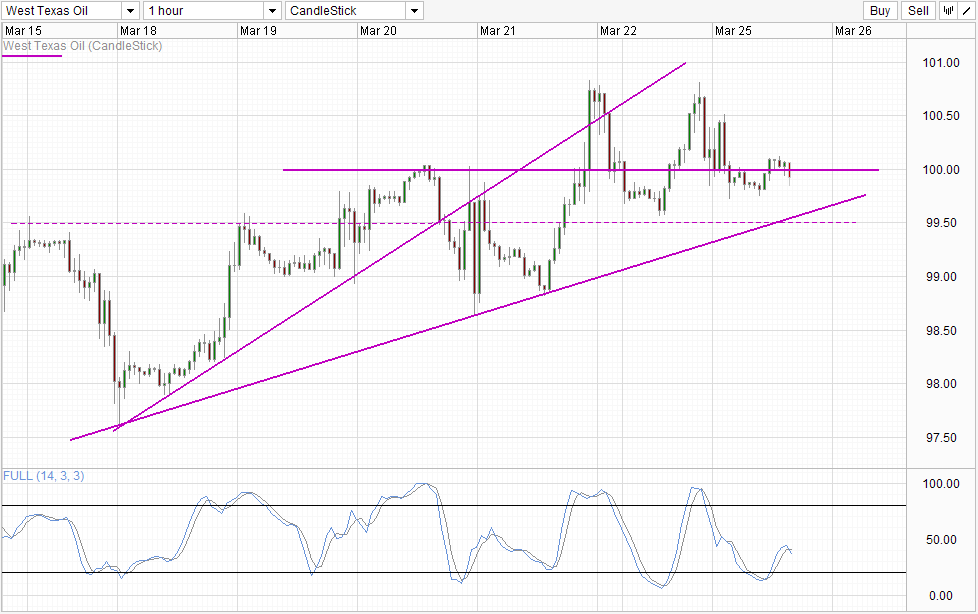
Prices are back below 100.0 once again, but we can't blame bulls for not trying. Indeed, prices were mostly bullish on Monday, with prices able to climb to a high of 100.81 even though both German and Chinese Manufacturing PMI numbers were below expected. Prices only started to collapse during US session when the "risk off" sentiment fuelled by weaker than expected US PMI numbers finally did bearish damage. But even then, prices managed to stay above 100.0 for a respectable period before finally succumbing towards the end of US session.
We had more of the same this morning, when WTI prices started climbing once more during early Asian hours even though sentiment in Asian market was bearish as seen from losses across all major Asian stock indexes. Prices broke through the 100.0 level and stayed there for more than 3 hours, before creeping back lower yet again right now. From all these, we can draw the conclusion that WTI bulls remains in play, but equally to the task are bears that have been keeping gains in checked - a much easier task considering that global risk appetite and economic fundamentals favor lower crude prices.
Hourly Chart
Thanks to the stubbornness of Bulls, the S/T bullish momentum remains intact and we could see prices being supported via the lower rising trendline even if we fall further. This notion is supported by Stochastic indicator which will most likely be within the Oversold region when prices hit close to the region. Even if the trendline fails, 99.50 can be expected to provide support as well. Hence, it will take significant effort to push prices down and it is unlikely that a sharp sell-off will occur.
Daily Chart
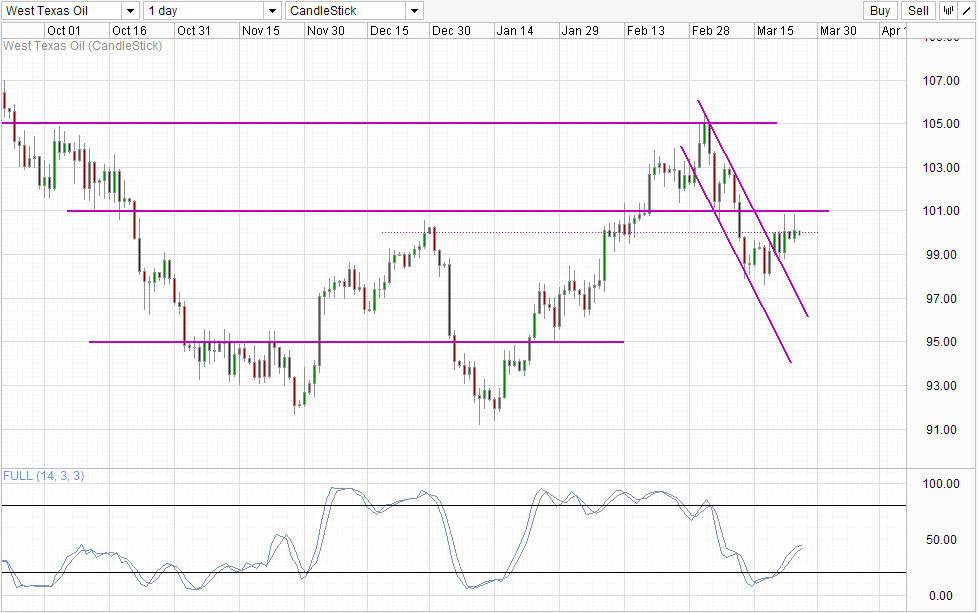
Daily Chart shows prices breaking away from the descending Channel, and we should have seen strong bullish follow-through emerging from here as the break coincided with a bullish cycle signal from Stochastic indicator. Hence, the failure to even tag 101.0 resistance since is a huge red flag that bullish momentum isn't really as strong as we think, and that increases downside risks towards Channel Top if S/T momentum reverses.
This would also mean that the window of opportunity for bulls to push higher is getting smaller and smaller, and even though S/T momentum remains bullish, these bulls are running on empty without any fundamental support and eventually they themselves will become disappointed and disillusioned if they fail to overcome 101.0 or even 100.0 convincingly. Given this potential outcome, traders who want to bet on the bullish momentum may wish to wait for a break of 101.0 in hope that bulls will be able to gain a second wind which will encourage them to take up even more long positions (however unwarranted it may be). Alternatively, traders may simply need to wait for current bulls to exhaust themselves, and once that happen the bears will be out in force and we could easily see acceleration back to low $90s per barrel.
Which stock should you buy in your very next trade?
AI computing powers are changing the stock market. Investing.com's ProPicks AI includes 6 winning stock portfolios chosen by our advanced AI. In 2024 alone, ProPicks AI identified 2 stocks that surged over 150%, 4 additional stocks that leaped over 30%, and 3 more that climbed over 25%. Which stock will be the next to soar?
Unlock ProPicks AI

