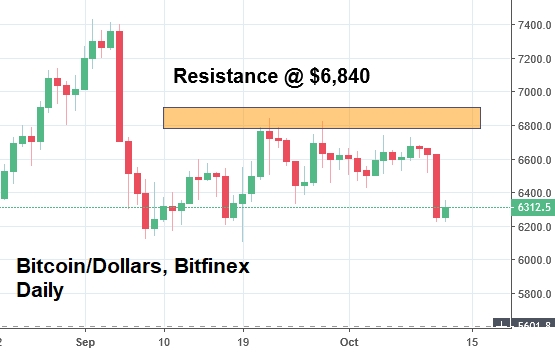
It was another rough week for Bitcoin and the rest of the crypto market, as Bitcoin plunged 5.7% last Thursday, dropping below the $6,300 price level for the first time since late September.
A drop that large, which used to be commonplace for Bitcoin in terms of dollars, has become somewhat of a rare occurrence in recent weeks. BTC’s volatility has steadily decreased ever since it took a major dive on September 5th, and many traders (including myself) were eyeing this volatility contraction as a potential sign of an upcoming breakout.
And a breakout certainly looked possible on the daily candlestick charts last week. Bitcoin kept chopping up and down (a good sign) and trading sideways, as it approached a level of resistance at $6,840.
Obviously, a breakout never happened, as you can clearly see in the chart above. At the time of writing, Bitcoin began to recover, though, and it looks like the bleeding may have stopped just short of $6,200, a point of support set after the four-day sell-off that started on September 5th.
When we zoom in on the daily candlesticks (like we did above), it can certainly be easy to get discouraged about Bitcoin’s current position – and I don’t blame investors that have the crypto blues at the moment, especially if they bought-in at the end of 2017, during Bitcoin’s historic run.
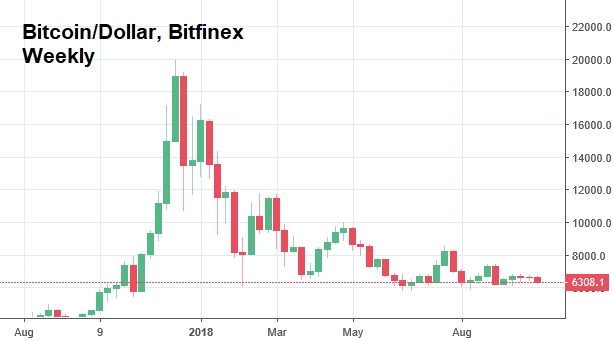
But let’s put those gloomy thoughts away for a moment, and take a longer look at Bitcoin in terms of dollars, since the start of the year:
Okay – now that 5.7% drop on Thursday doesn’t look so bad, does it?
Crypto investors that were disappointed by the Bitcoin plunge last week obviously forgot how bad it used to be, when crypto was undergoing periods of extreme volatility earlier this year.
In fact, it almost looks like Thursday’s Bitcoin sell-off (which dragged down the most recent weekly candlestick above) actually condensed Bitcoin’s volatility further in the weekly candlestick chart – even though the daily candlesticks would imply that volatility is back to ruin our crypto portfolios.
So, all-in-all, despite the sudden daily drop (most of which occurred in just 30 minutes on Thursday), Bitcoin prices still seem like they’re right on track for a breakout as the market continues to chop sideways long-term. The key support level at roughly $5,700 has yet to broken despite being touched upon several times, and investors continuously gobble up Bitcoin whenever it falls far enough – buying it back in droves after any major scandal hits the news.
With an ETF decision on the horizon (that the SEC has to eventually address), in addition to the creation of a Bitcoin marketplace by the NYSE owners, the Intercontinental Exchange, an intriguing cocktail of prosperity could be brewing – simmering just beneath the surface of crypto’s inactivity these last few weeks.
And sure, Bitcoin could also drop back down to key support yet again, but if that did happen – would it really be a bad thing?
Whenever Bitcoin tested key support this year, it recovered every time without fail, and it looks like the next rally could ultimately be the one that sticks.


