A few weeks ago, Urban Carmel at The Fat Pitch wrote a post that concluded that the NYSE Advance / Decline line (NYAD) was a poor timing indicator. I generally agree with his assessment.
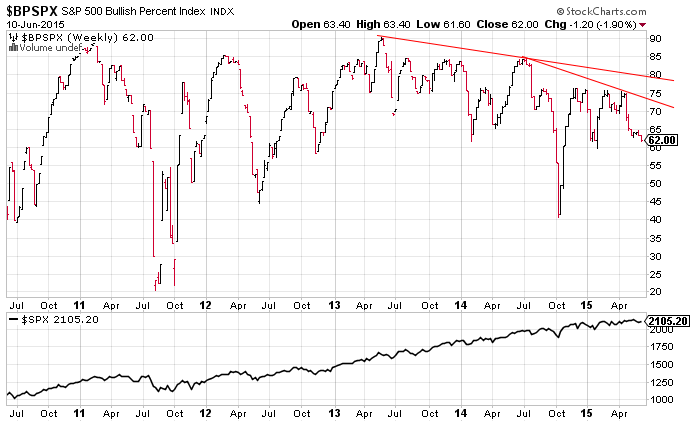
I think that most measures of breadth by themselves are poor timing indicators. Markets can fall even when breadth is healthy and breadth often diverges at market tops for a very long time before the market actually falls. For example, the Bullish Percent Index (BPSPX) and the percent of stocks below their 200 day moving average have been diverging with the S&P 500 index (SPX) for over a year (or two depending on how you count).

The fact that breadth isn’t timely is why I don’t use it as a part of my “core” indicators. Instead, you’ll hear me refer to various forms of breadth as ancillary or secondary indicators that give good background information. So what information does it give? Answer: When breadth is poor the odds increase that a decline will be large. If breadth is healthy the odds increase that a decline will be small. When breadth is poor it is like a house with a shaky foundation. An earthquake might not cause the house to fall, but the odds of it falling are greater.
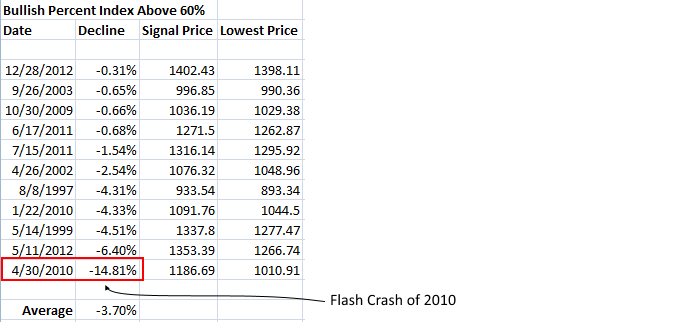
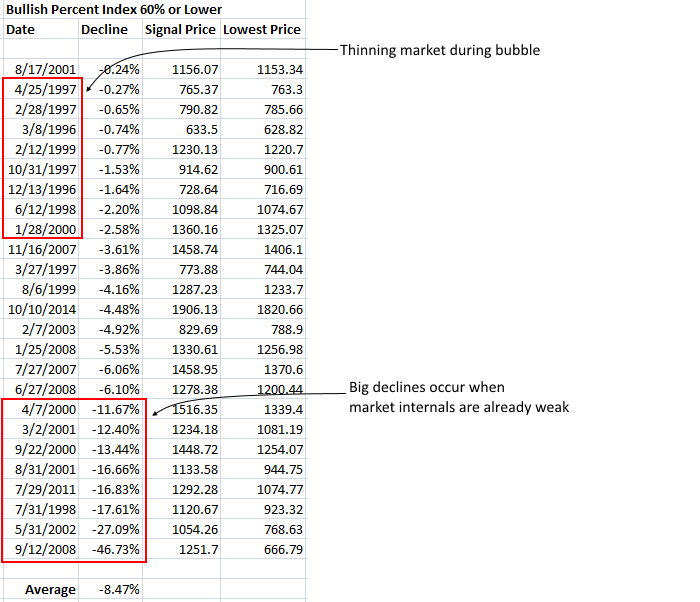
As an example, let’s look at my Market Risk Indicator signals since 1996, cut into two categories. One where the BPSPX is above 60 and the other when it is 60 or below. Looking at the two charts below you’ll see that my market risk indicator is more likely to signal when breadth is poor. In addition, it is three times more likely that a decline from the signal date to the low will be more than 10%. With the BPSPX over 60 the average decline was 3.7% while 60 or below on the BPSPX saw an average decline of 8.4%.


I’ve got similar (but not exactly the same) results using divergences in NYAD or a weak percent of stocks below their 200 day moving averages. They don’t signal every 10% decline, but they substantially increase the odds that the decline will be large. As a result, I look at several measures of breadth and use the weight of the evidence to determine how aggressive I want to be with a hedge that results from Market Risk.
My goal is to hedge out risk when the odds increase that a large decline is ahead. Breadth is one thing that tilts the odds. That’s why it matters.
Which stock should you buy in your very next trade?
With valuations skyrocketing in 2024, many investors are uneasy putting more money into stocks. Unsure where to invest next? Get access to our proven portfolios and discover high-potential opportunities.
In 2024 alone, ProPicks AI identified 2 stocks that surged over 150%, 4 additional stocks that leaped over 30%, and 3 more that climbed over 25%. That's an impressive track record.
With portfolios tailored for Dow stocks, S&P stocks, Tech stocks, and Mid Cap stocks, you can explore various wealth-building strategies.
