With yesterday's hefty gains taken off the table, and a new profitable position that has them secured already, will the S&P 500 let me add to the tally some more still today?
Given yesterday's Powell-testimony-induced wild swings and preceding strong retail sales data, it's not unimaginable that we're in for another enjoyable ride today as well.
Yes, I think that the grind higher in stocks remains on, slow or not so slow.
S&P 500 in the Short-Run
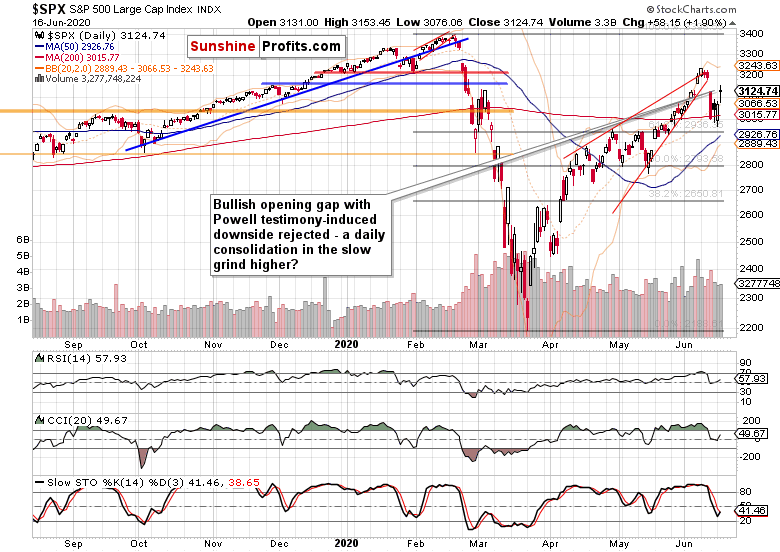
Let’s start with the daily chart perspective (charts courtesy of http://stockcharts.com ):

As I looked for them to do, the stock bulls reasserted themselves, and the open long position profits kept growing post the Fed individual corporate bonds buying announcement, and I walked off with an almost 140-point realized profit as Powell didn't catapult stocks immediately higher. Worry not, my other open trade has been unfolding favorably as well, having ended with a 24-point gain!
But what about the daily chart?
The speed with which prices cleared the 61.8% Fibonacci retracement is lending credibility to the bull market thesis. It's not unexpected that a sharp plunge of Thursday's caliber gives way to a brief consolidation that attempts to move the market either way, eventually followed by similarly sharp rebound. That's a fitting description of what we have seen on Monday and yesterday.
Such were my observations yesterday:
(…) Reflecting upon the rebound's veracity, the still bearishly looking daily indicators are likely to turn much more positive for the bulls quite soon. Yesterday's volume also gives no reason to doubt the reversal, showing that buy-the-dip mentality won the day.
Should this paradigm hold, then the price consequences of the bearish wedge breakout invalidation and of the island top reversal, would be over pretty soon. I wouldn't be too afraid of stocks approaching the lower border of Thursday's bearish gap, or even of prices moving back near the declining support line connecting the March and May lows.
I consider these technical features as short- to medium-term challenges to the stock bull market, that the bulls would overcome. In other words, I treat the bull market as intact, and merely undergoing a healthy correction that wouldn't result in much technical damage.
They remain valid also today – and with the improving posture of the daily indicators, even more so. Yesterday's volume is certainly consistent with the daily consolidation hypothesis, meaning that stocks can continue higher.
What's the credit markets' opinion?
The Credit Markets’ Point of View

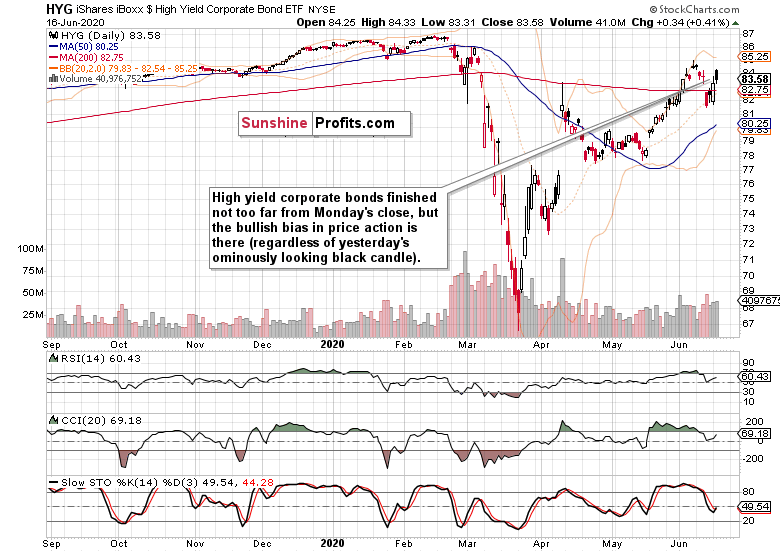
High yield corporate bonds (HYG ETF) gapped strongly, but gave up much of their opening gains as the Powell testimony kicked in. I would read the daily setback suffered as just that – a daily setback, and not a reversal. The volume doesn't point to corporate bonds moving lower, and their uptrend remains entrenched.

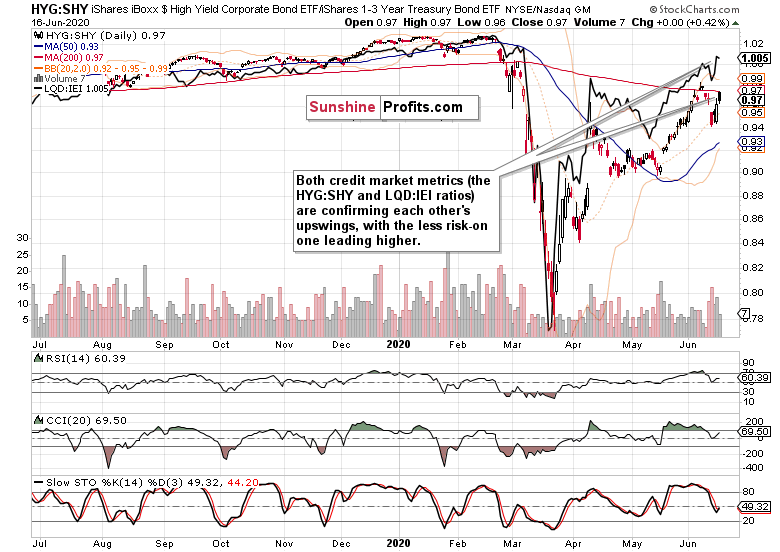
Both the leading credit market ratios – high yield corporate bonds to short-term Treasuries (HYG:SHY), and investment grade corporate bonds to longer dated Treasuries (LQD:IEI) – keep moving higher, with the less risk-on one (LQD:IEI) being in the driver's seat. The stock bulls have a reason to cheer both moves.

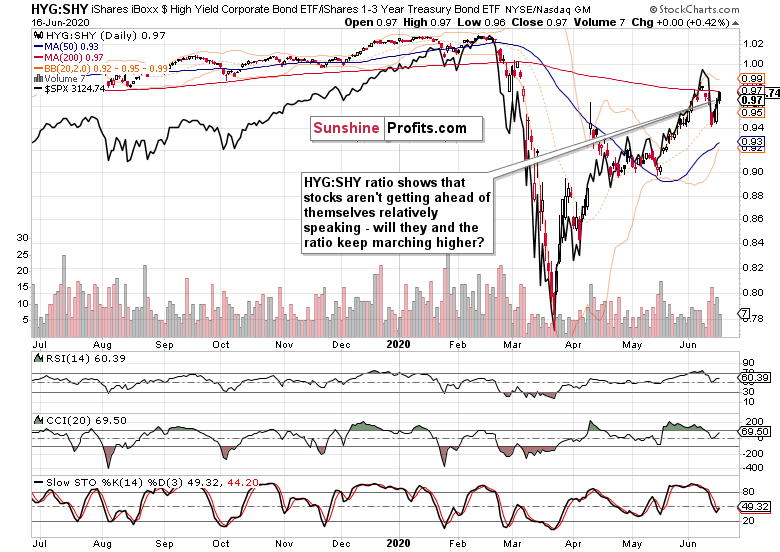
The HYG:SHY ratio with overlaid S&P 500 (black line) shows that stocks aren't getting ahead of themselves. Now that we have checked the closeness of their mutual relationship, the key question is of course the short-term path of both the ratio (with the HYG ETF being its arguably key determinant) and stock themselves.
In my opinion, that remains overall higher despite the many clouds on the horizon. After all, that's what bull markets do – they climb a wall of worry.
Key S&P 500 Sectors in Focus
Technology (XLK ETF) isn't too far from its early June highs, with semiconductors (XSD ETF) keeping pace. Healthcare (XLV ETF) has some more work left to do on the upside, which is similar to the financials (XLF ETF).
The performance of the stealth bull market trio of energy ((NYSE:XLE) ETF), materials (XLB ETF) and industrials (XLI ETF) hasn't been spectacular yesterday, but remains consistent with the unfolding upswing.
The many sectors are working to repair Thursday's damage, and technology with semiconductors is leading to the upside – it's as simple as that.
The stock bull market is still young, and far from a top.
Summary
Summing up, risk-on sentiment ruled yesterday's premarket session, and eventually recovered from the Powell testimony coinciding with downside volatility. The credit market analysis shows that the upswing isn't getting ahead of itself, and remains likely to continue. Treasury yields have slowly risen again, contributing to the recovery narrative and flight to stocks. Smallcaps (IWM ETF) are on board, leading the S&P 500 higher. This is just as good for the 500-strong index advance as its market breadth or technology's (and semiconductor's) leadership is.
Disclaimer:
All essays, research and information found above represent analyses and opinions of Monica Kingsley and Sunshine Profits' associates only. As such, it may prove wrong and be subject to change without notice. Opinions and analyses were based on data available to authors of respective essays at the time of writing. Although the information provided above is based on careful research and sources that are believed to be accurate, Monica Kingsley and her associates do not guarantee the accuracy or thoroughness of the data or information reported. The opinions published above are neither an offer nor a recommendation to purchase or sell any securities. Ms. Kingsley is not a Registered Securities Advisor. By reading Monica Kingsley’s reports you fully agree that she will not be held responsible or liable for any decisions you make regarding any information provided in these reports. Investing, trading and speculation in any financial markets may involve high risk of loss. Monica Kingsley, Sunshine Profits' employees and affiliates as well as members of their families may have a short or long position in any securities, including those mentioned in any of the reports or essays, and may make additional purchases and/or sales of those securities without notice.
