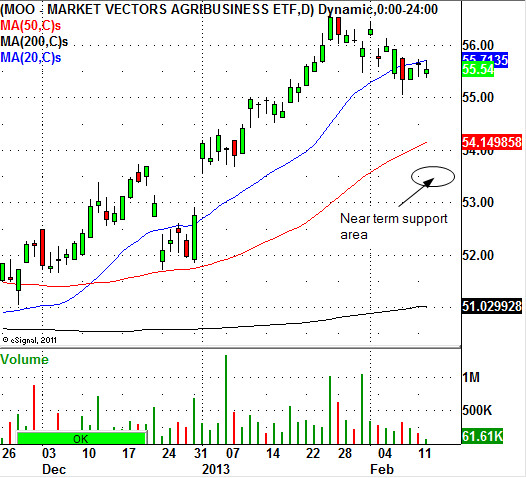
Since November 15, 2013, the Market Vectors-Agribusiness ETF (MOO) has been steadily rising with the major stock indexes. It looks as if MOO made a short term high on January 25, 2013 at $56.55 a share. The current pattern on the daily chart for MOO is not really bad, it is just a simple consolidation pattern that will most often lead to further upside. Traders should watch for an important support level for the MOO around the $53.50 level, which looks to be an important near term support level on the daily chart.
Some of the top holdings inside of the MOO include Monsanto Co (MON), Potash Corp Sask Inc (POT), and Mosaic Co (MOS). All of these stocks are holding up very well at this time, however a milder pull back on the daily charts should not be ruled out in the near term.

Some of the top holdings inside of the MOO include Monsanto Co (MON), Potash Corp Sask Inc (POT), and Mosaic Co (MOS). All of these stocks are holding up very well at this time, however a milder pull back on the daily charts should not be ruled out in the near term.

3rd party Ad. Not an offer or recommendation by Investing.com. See disclosure here or remove ads.
Which stock should you buy in your very next trade?
With valuations skyrocketing in 2024, many investors are uneasy putting more money into stocks. Unsure where to invest next? Get access to our proven portfolios and discover high-potential opportunities.
In 2024 alone, ProPicks AI identified 2 stocks that surged over 150%, 4 additional stocks that leaped over 30%, and 3 more that climbed over 25%. That's an impressive track record.
With portfolios tailored for Dow stocks, S&P stocks, Tech stocks, and Mid Cap stocks, you can explore various wealth-building strategies.
