Recently I have been analyzing long-term volatility trends using daily results from the S&P 500 index. One of the things I calculated was the high-low daily range expressed in percentage.
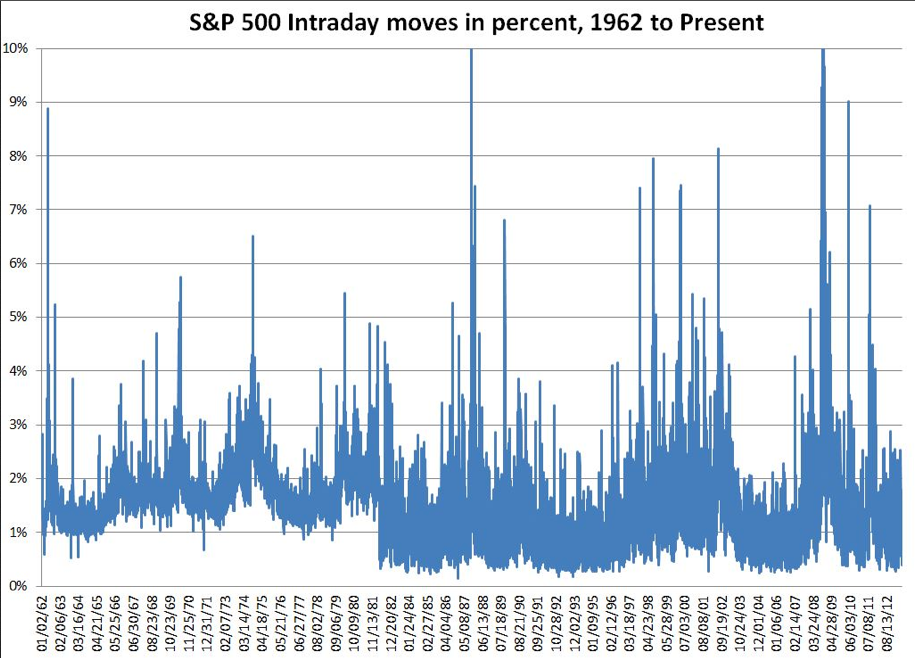
The chart looks like this:
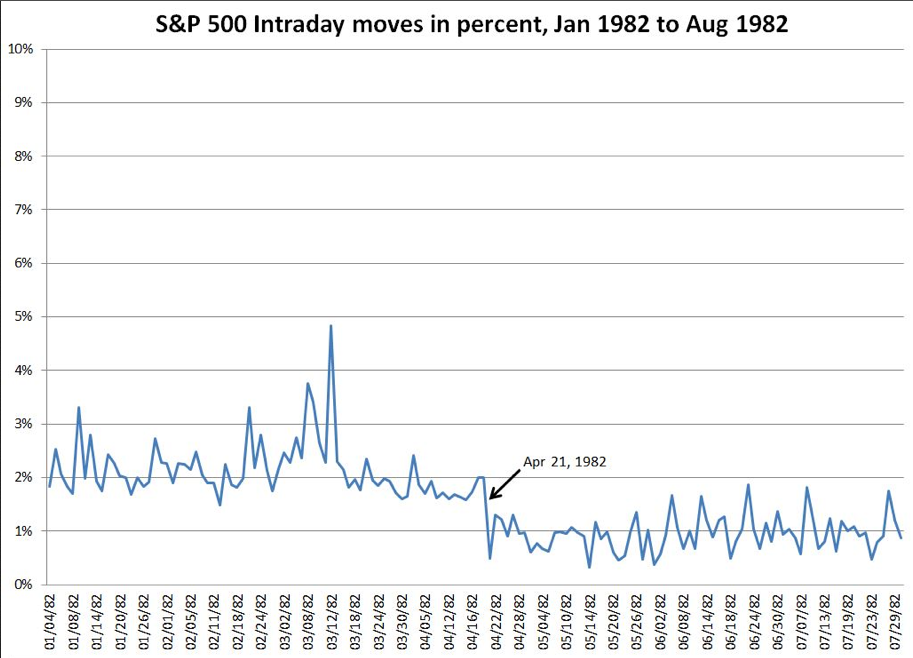
What caught my eye was the drop in the lower bound in 1982. Before 1982, the daily range rarely dropped below 1% and then it dropped instantaneously to around 0.3%. The upper bound did not seem to be significantly affected. I zoomed in on the first half of 1982.
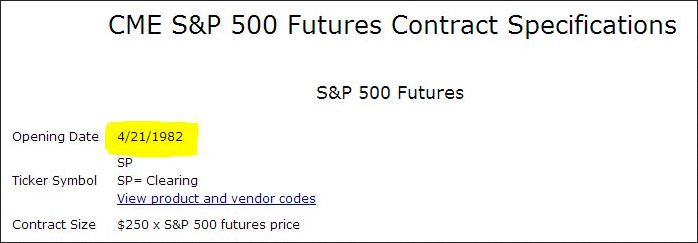
The shift happened on April 21, 1982. That date didn’t ring any bells for me, so I did a Google search and found this.
This was the day S&P 500 Futures started trading. I don’t think the change in the intraday range was a coincidence. The S&P 500 index went from being a metric to an investible security, and the behavior of the entire market was impacted. This change was almost certainly driven by arbitrage. With futures it’s straightforward to capture any signficant differences between what a future is trading at and the value of the underlying stocks (see this post for more info). Arbitrage tends to keep the futures price aligned to the index, but since the underlying stocks are being bought/sold en-masse as part of the arbitrage operation -- without regard to their individual situation it also increases the correlation between stocks in the index.
Since this beginning in 1982, the rise of the tradable index has changed the face of investing, and is one of the key drivers of the increased volatility of the market.
Which stock should you buy in your very next trade?
AI computing powers are changing the stock market. Investing.com's ProPicks AI includes 6 winning stock portfolios chosen by our advanced AI. In 2024 alone, ProPicks AI identified 2 stocks that surged over 150%, 4 additional stocks that leaped over 30%, and 3 more that climbed over 25%. Which stock will be the next to soar?
Unlock ProPicks AI

