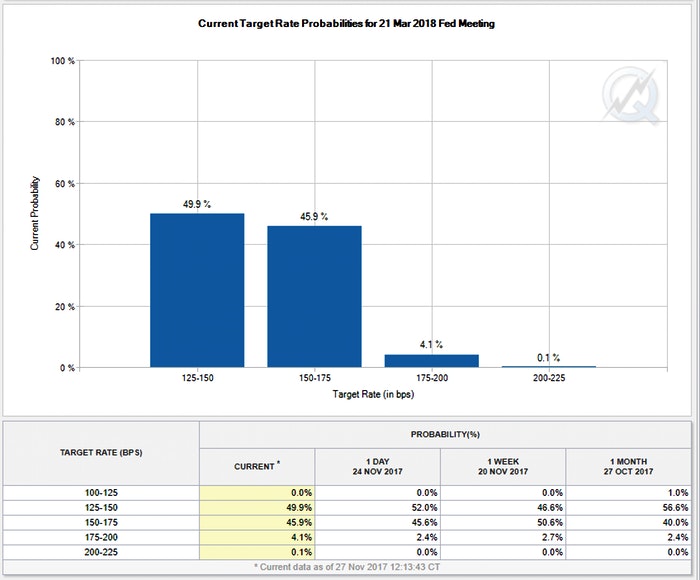
Futures positions imply a 92% chance the Fed will hike in Dec and 50% again in March. How will the yield curve respond?
Let's start with a discussion of how the short-end of the yield curve will act.
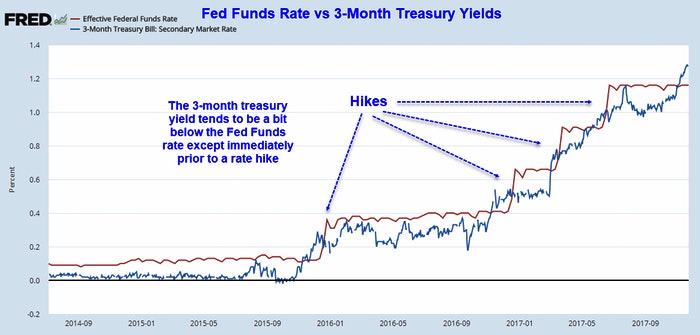
The following chart shows that when the yield on 3-month treasuries jumps above the Fed Funds rate, a rate hike is imminent.

CME futures suggest a 92% chance in December and just over 50% in March.

If the Fed does get in two rate hikes, what would the yield curve look like?
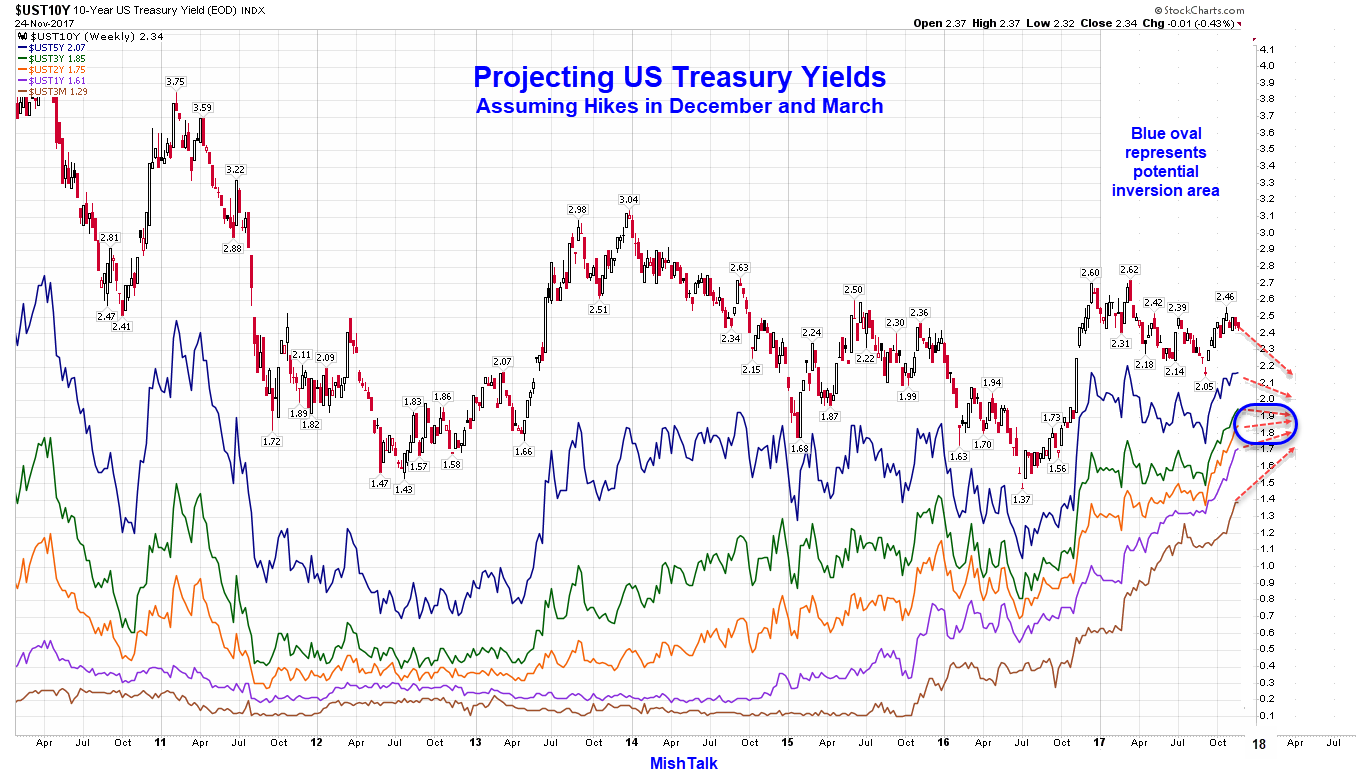
I suggest something like the following.
3-Month to 10-Year US Treasury Yield Projection

My base assumption is consumer price inflation is not about to jump significantly higher, and if not, there will be downward pressure on long-term yields.
The short-end of the curve is easier to predict. Add 50 basis points of hikes, then subtract about 5-10 basis points corresponding to the patterns in the first chart.
Inversion Chances
The blue oval represents an area in which we may see a yield curve inversion (longer-dated treasuries yield less than shorter-dated treasuries).
Should that occur, it will be a strong recession warning.
An inverted curve does not guarantee a recession, however, nor does lack of inversion mean a recession will not happen.
Regardless, we are very close to the end of this rate hike cycle.
Which stock should you buy in your very next trade?
With valuations skyrocketing in 2024, many investors are uneasy putting more money into stocks. Unsure where to invest next? Get access to our proven portfolios and discover high-potential opportunities.
In 2024 alone, ProPicks AI identified 2 stocks that surged over 150%, 4 additional stocks that leaped over 30%, and 3 more that climbed over 25%. That's an impressive track record.
With portfolios tailored for Dow stocks, S&P stocks, Tech stocks, and Mid Cap stocks, you can explore various wealth-building strategies.
